Crude Oil Price Forecast 2020: WTI bulls to hold their horses despite tighter market, rosier economy
- Crude oil price to rise initially before correcting in the latter part of 2020.
- Improved economic outlook, IMO 2020 and shrinking supply to offer support.
- WTI price will likely maintain 2019’s range, with bias leaning to the upside.

The year 2019 was rather a balanced one for oil prices, as the early rise was evened out in the rest of the year. The US-China trade war fueled the global economic slowdown undermined the efforts of the Organization of Petroleum Exporting Countries (OPEC) and its allies to balance the crude market and ramp up oil prices.
Stepping into 2020, the oil industry is on a verge of witnessing a massive shake-up, in the face of the International Maritime Organization (IMO) regulations –IMO 2020– effective from January. Further, the global economic slowdown appears to have bottomed out while oil demand growth outlook has turned upbeat, calling for higher prices next year. The upside potential in oil prices, however, may be limited by a likely US-China trade re-escalation and dwindling Chinese oil demand.
2019: A phase of consolidation post-2018’s slump for crude oil price
Oil bulls failed to capitalize on Q1 2019 solid recovery following a $35 slump witnessed in the final quarter of 2018. The rest of 2019 saw the prices consolidating in a $15 narrow range, as markets remained divided over global oil demand outlook concerns. These issues have lingered over the 18-month long US-China trade war on one hand and, on the other, over the extension of the OPEC+ oil production cuts.
In December 2018, the OPEC+ reached a deal to take 1.2 million barrels per day (bpd) off the market for the first six months of 2019 to boost the market. In lieu of the output cuts, oil price recovered gradually until April, when it peaked.
Thereafter, the U-turn in price kicked-off but the downside remained cushioned after the OPEC+ decided to extend the supply cuts until March 2020 while the Chinese imports for oil continued to reach record highs.
The US protectionism was one of the main themes that dominated the oil price dynamics throughout 2019. US President Donald Trump shook the foundations of global trade, imposing steep tariffs on billions of dollars' worth of goods from the EU, Canada, Mexico and China.
Among other countries, China, in particular, was the worst hit by the trade tariffs and retaliated strongly, triggering a prolonged trade war that had a massive negative bearing on the global trade and economy as a whole. This was the main factor that curbed oil price recovery. Note that China is the world’s second-largest economy and no.2 consumer of oil.
Also, not to forget rising US crude inventories and geopolitical risks added to the choppy trend in oil prices. The US-Iran geopolitical conflict escalated after Iran was accused of attacks on Saudi Arabian oil fields in September. Oil price saw the biggest daily price surge since the financial crisis after the attacks but failed to sustain the rise amid bearish fundamentals.
Towards the end of 2019, crude price headed back towards September highs amid US-China trade deal optimism and OPEC+ agreement on deeper output cuts by an additional 500,000 bpd through to March 2020.
2020: A tale of two halves?
As mentioned above, the outlook for oil price looks more optimistic at the outset but unfortunately, that is unlikely to hold true as the year unfolds. Let’s dig deeper into what 2020 entails for the black gold.
H1 2020: Four bullish reasons for oil price
IMO 2020: An uptick in demand for oil could be seen in the first of half of next year, as IMO 2020 comes into effect next month. According to S&P Global Platts Analytics, “the IMO bunker-fuel specification change will push high-sulfur fuel oil, no longer allowed for use in maritime shipping, into power generation, requiring more middle distillates and low-sulfur fuel oil to satisfy demand in the shipping sector. The impact of IMO 2020 will favor sweet crudes (such as WTI and Brent).”
Rosier global economic outlook: With the US-China Phase One trade deal agreed, markets are expecting the global economy to stabilize in 2020, with an upturn seen in business activity in the advanced as well as Emerging Markets (EM) economies. This is likely to lift the oil demand growth and bump up oil price.
Tightening oil market: The effect of the deeper OPEC+ output cuts will gradually realize and tighten the market further, with traders still hopeful that the alliance will extend the cuts through Dec 2020.
The OPEC kept its 2020 economic and oil demand growth forecasts steady but pointed to a small deficit of 0.30 mbpd in the oil market even before the deeper cuts could take effect from January 1. OPEC said non-OPEC supply will grow by 2.17 mbpd in 2020, lower than earlier July forecast amid subdued oil Capex and drilling activities for US shale oil.
Political troubles will likely continue to tamper exports from Iran, Libya and Venezuela, spiraling the supply crunch.
Geopolitical risks/ Extreme weather: Oil supply risks will continue to persist in the face of the ongoing US-Iran conflict, as long as the US sanctions against Iran remain effective following the nuclear deal fallout. Iran is OPEC’s no. 2 oil exporter after Saudi Arabia.
Meanwhile, extreme weather conditions due to global warming will likely become one of the key factors determining the oil demand. As warned by the environmental activists, a massive shift in the heating and cooling cycles are expected to have a negative impact on harvests, climate and other natural occurrences, in turn affecting the economic activity and global energy consumption.
H2 2020: Four reasons why oil price could risk a correction
Weakening China’s oil demand: Amid trade war and OPEC+ cuts euphoria, markets failed to notice that demand-side equation for oil in 2019 was majorly driven by China’s appetite for fuels. The dragon nation reported record-high crude oil imports in November, up over 10% in the first 11 months of 2019 on an annualized basis.
China's rising crude oil imports could be seen on the back of Beijing’s stockpiling to build its strategic petroleum reserve (SPR) and a sharp rise in refining capacity. According to the experts, China’s crude oil stockpiling is likely to ease after the first half of 2020. Further, should the global economic outlook deteriorate, a drop in exports of its refined products will likely follow. These factors could render negative for oil prices.
US-China trade re-escalation: Despite the US-China Phase One trade deal agreement, the skepticism over its details continue to keep the markets on the edge while the US’ impending issues with China over intellectual property (IP) and agricultures purchases will likely remain an area of concern going forward. Also, the Phase Two negotiations will be closely watched and remain a key risk that could re-escalate trade tensions between the two economies, denting global growth once again.
Fading IMO 2020 impact: Industry experts believe that the price influence of IMO 2020, in terms of the increased demand, is expected to peak in March-May. In the second half of 2020, the IMO support-driven oil demand is expected to eventually wear out, as the uncertainty around the IMO 2020 regulations will recede and the shipping companies become more compliant.
Rising global oil inventories: The International Energy Agency (IEA), in its latest monthly report, predicted global oil inventories to rise in Q1 2020. This may be outweighed by the OPEC+ cuts induced optimistic wave. However, if the pace of global oil inventories surge quickens later in 2020, it could affect the efforts by the OPEC+ to shore up the prices.
WTI Oil Technical Analysis
It’s prudent to look at the bigger picture, as painted by the weekly chart.
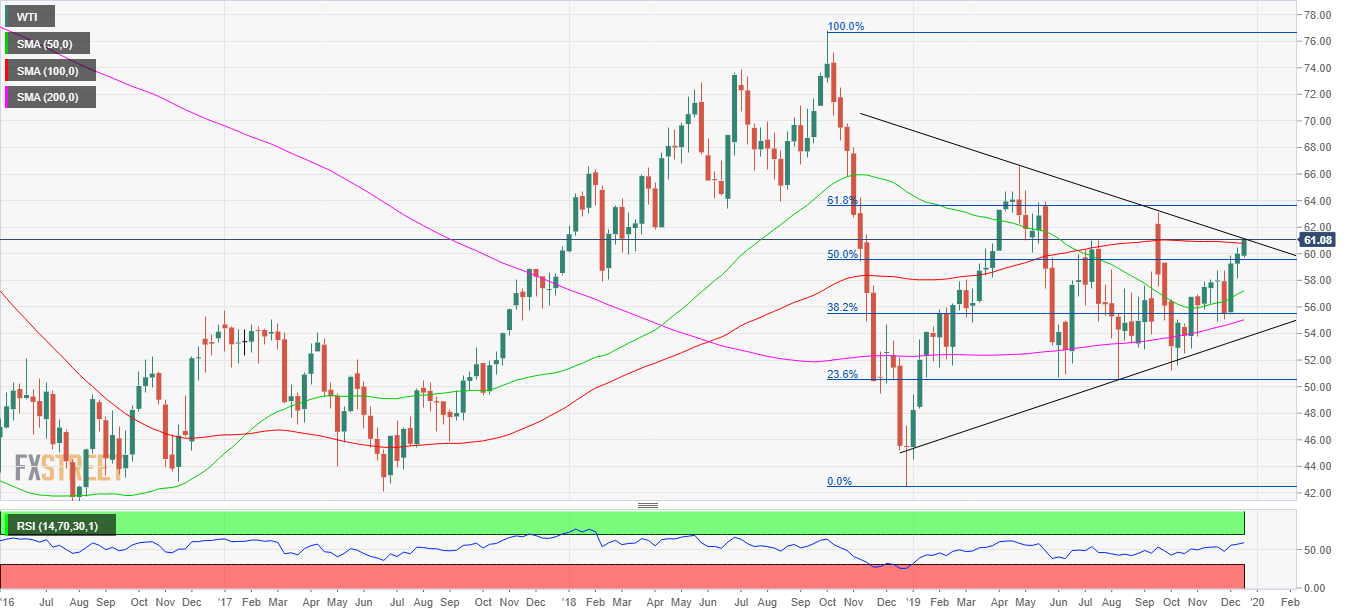
WTI is on a verge of charting a symmetrical triangle breakout, having traversed within the triangle throughout the past year. A symmetrical triangle pattern confirmation will likely portray a bullish outlook for the black gold in the medium-term.
On the upside, the advances could face initial rejection $63.20-$63.60 area, the confluence of the intermittent tops and 61.8% of the Fibonacci Retracement (Fib) of Oct 2018-Dec 2018 slump. The uptrend will gain momentum above the last supply zone, opening doors towards 2019 highs of $66.57. A test of the $70.00 level will be inevitable if the bulls take out the yearly high.
The Relative Strength Index (RSI) is pointing higher near 60.50, suggesting further scope for upside, as it still hasn’t entered the overbought territory. Meanwhile, the WTI price has scaled above all the major Simple Moving Averages (SMA) on the weekly chart, sticks that collaborate with the upbeat view on WTI.
Alternatively, a failure to sustain above the 61.8% Fib resistance, the sellers could take over and knock down the rates back around $57-$55, where the 50-week SMA, 38.2% Fib of the 2018 crash, 200-week SMA and rising trendline support form a cluster of solid support.
Further to the downside, the $50 mark is the level to beat for the bears and could call for a bearish reversal should the bulls fail to defend it. Subsequently, the 2019 low of $44.52 will get exposed followed by the swing low of $42.45 that will emerge as a critical level.
All in all, with strong support levels aligned for WTI, the trend appears for higher prices before the consolidation phase sets in.
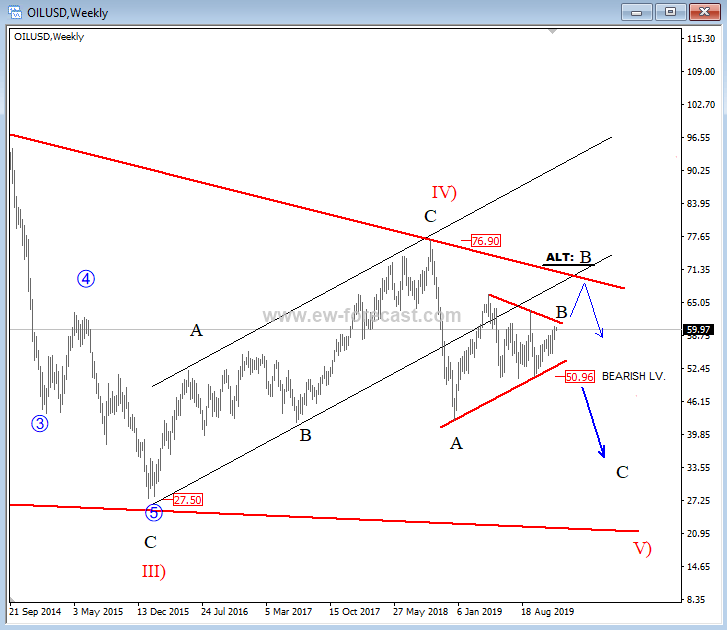
Gregor Horvat sees potential bearish action on WTI crude barrels when conducting his Elliott Wave analysis:
WTI Oil Elliot Wave Analysis

As we expected in 2019, Crude oil has nicely recovered for wave B of V), which looks like a corrective and bearish triangle pattern that can be approaching the end soon, ideally early next year. But until we see a reversal on lower time frame charts we also have to be aware of the alternate count; higher wave B that may stop around $70 per barrel; near the long-term falling trendline. But no matter how we look at it, we think that oil can be seen below 40$ at the end of 2020.
Forecast Poll 2020
| Forecast | H1 - Jun 30th | H2 - Dec 31st |
|---|---|---|
| Bullish | 66.7% | 50.0% |
| Bearish | 22.2% | 44.4% |
| Sideways | 11.1% | 5.6% |
| Average Forecast Price | 62.54 | 61.71 |
| EXPERTS | H1 - Jun 30th | H2 - Dec 31st |
|---|---|---|
| Alexander Douedari | 63.00 Bullish | 54.00 Bearish |
| Andrew Lockwood | 70.00 Bullish | 75.00 Bullish |
| Andrew Pancholi | 50.56 Bearish | 55.97 Bearish |
| Brad Alexander | 67.00 Bullish | 68.00 Bullish |
| Chris Weston | 58.00 Bearish | 55.00 Bearish |
| Christina Parthenidou | 62.00 Sideways | 70.00 Bullish |
| Dmitriy Gurkovskiy | 70.00 Bullish | 83.00 Bullish |
| Dukascopy Bank Team | 66.35 Bullish | 58.00 Bearish |
| Eagle FX Team | 65.55 Bullish | 75.05 Bullish |
| Gregor Horvat | 50.00 Bearish | 40.00 Bearish |
| Ipek Ozkardeskaya | 63.00 Bullish | 65.00 Bullish |
| Jamie Saettele | 63.00 Bullish | 67.00 Bullish |
| Jeff Langin | 68.00 Bullish | 66.00 Bullish |
| Jose Blasco | 54.00 Bearish | 48.00 Bearish |
| Nenad Kerkez | 69.70 Bullish | 60.80 Sideways |
| OctaFx Analyst Team | 66.52 Bullish | 50.00 Bearish |
| Stelios Kontogoulas | 60.00 Sideways | 50.00 Bearish |
| Stephen Innes | 65.00 Bullish | 65.00 Bullish |
After completing the correction, WTI continues the ascending tendency. If economic indicators improve in the future, the instrument may continue growing towards 70.00. At the end of 2020, it is conceivable that the price may stop at 83.00.
Hard to see real upside in crude when OPEC are losing market share, but a balance market and improved feel to global growthr risks in 2020 should keep crude around current levels.
by Chris Weston
Related 2020 Forecast Articles
EUR/USD: Lean times soon to turn into flush times for euro dollar
GBP/USD: Pound may continue to fall on hard Brexit deadline
USD/JPY: A journey from trade fears to high-stakes elections
AUD/USD: May the aussie live in interesting times
USD/CAD: Canada and loonie are well positioned but not in control
Gold: XAU/USD bulls likely to remain in control
USD/INR: Domestic factors barely support a turnaround for Indian rupee
Bitcoin: BTC, the ultimate store of value
Ethereum: Calm on ETH/USD after the storm is over
Ripple's XRP: The glimpse of hope
Author

Dhwani Mehta
FXStreet
Residing in Mumbai (India), Dhwani is a Senior Analyst and Manager of the Asian session at FXStreet. She has over 10 years of experience in analyzing and covering the global financial markets, with specialization in Forex and commodities markets.


