Gold Price Forecast: XAU/USD tests $1,820 as USD capitalizes on US CPI data
- Gold Forecast: A big miss on US CPI to drive XAU/USD above 200-DMA? [Video]
- Gold Weekly Forecast: XAU/USD could target 200-day SMA
- Gold analysis: Reveals support zone
- All eyes turn to inflation data for gold's next big move – What’s next? [Video]
- Gold Price Analysis: XAU/USD set to surpass the 2020-2021 trendline at $1865 – Commerzbank

Gold Forecast for 12 May 2021: A big miss on US CPI to drive XAU/USD above 200-DMA? [Video]
Gold pressured amid fears of rising inflation, interest rates.
Having failed to sustain above $1840 once again Gold price fell as low as $1818 on Tuesday before recovering losses to end the day marginally higher around $1837. The two-way price action kept investors on their toes. Gold prices dropped sharply after the US dollar rebounded from multi-month lows on the renewed risk-aversion wave, triggered by rising inflation concerns. Investors remain concerned about overheating of the US economy, as the Treasury yields recaptured the 1.60% level. Rising inflation expectations brought the Fed’s taper calls back on the table, which spooked the markets and triggered a sell-off on Wall Street. The US stocks slide, however, helped gold recover some shine.
Heading into the US CPI showdown this Wednesday, gold returns to the red zone, as the US dollar’s safe-haven demand remains in vogue amid an escalation of tensions between Israel and Gaza. Further, markets remain unnerved ahead of the US CPI April month report amid concerns of a potential acceleration in price pressures and its implication on the economy.
The US CPI is seen arriving at 0.2% MoM in April vs. March’s 0.6% while the core figure is seen steady at 0.3%. On an annualized basis, the CPI is likely to accelerate to 3.6% in the reported month vs. 2.6% previous. The 12-month core rate is seen higher at 2.3% vs. 1.6% last. A CPI disappointment could tame inflation fears and squash Fed’s tapering and tightening expectations, which is likely to trigger a renewed burst of demand for the gold price.
Gold forecast 2021 /05/12
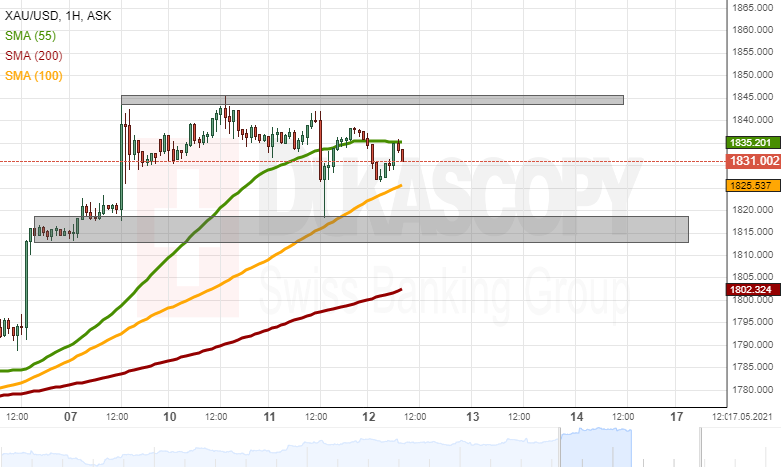
On Tuesday, the yellow metal did not find support in the 55-hour simple moving average near 1,830.00. Instead, the price declined to the 1,818.20 level. The event confirmed that the 1,812.80/1,818.20 zone could provide support in the future.
During the early hours of Wednesday's trading, the price was located in the middle between the 1,812.80/1,818.20 support zone and the resistance of the 1,843.80/1,845.50 zone.
In the case of the commodity price managing to pass the resistance of the 1,843.80/1,845.50 zone, the metal could test the 1,850.00 level and afterward the February high level at 1,855.00.
On the other hand, a potential decline below 1,812.80/1,818.20 could reach the 1,800.00 level and the 200-hour simple moving average.
US dollar’s haven demand lifted on Middle East tensions
“Heading into the US CPI showdown this Wednesday, gold returns to the red zone, as the US dollar’s safe-haven demand remains in vogue amid an escalation of tensions between Israel and Gaza. Further, markets remain unnerved ahead of the US CPI April month report amid concerns of a potential acceleration in price pressures and its implication on the economy.”
“A CPI disappointment could tame inflation fears and squash Fed’s tapering and tightening expectations, which is likely to trigger a renewed burst of demand for the gold price.”
“A daily closing above the 200-DMA at $1850 could revive the bullish bets towards the $1900 mark.”
“Gold prices could challenge Tuesday’s low of $1818, below which the May 7 low of $1813 will be on the sellers’ radars. The 100-DMA at $1796 could act as a strong support if the correction from multi-month highs of $1846 regains traction.”
At the time of writing, gold price is flat in Asia following a mixed day overnight. The price is consolidated at $1,836 following a choppy trading day and steep correction where the dip was an attractive discount for the bulls. Asia's sharp equity declines at the start of the week were mirrored as the Europeans came online which transpired into a sour day on Wall Street as well. The US dollar was mixed against the G10 and gold took advantage of bouts of weakness.
On the eve of the US Consumer Price Index, investors bet that rising inflation could erode the greenback away and the US dollar hit a 2-1/2-month low early in the New York session. However, the greenback then firmed around those levels on Tuesday afternoon. Overall, markets believe the Federal Reserve will keep its commitment to low rates and hefty asset purchases which is a supportive factor for the precious metal in the longer run.
Gold price forecast could be affected by the US bond markets situation, the inflationary concerns amidst the commodities boom pushed yields higher. The 2-year government bond yields added 1bp from 0.15% to 0.16%, and the 10-year government bond yields rose 3bps from 1.60% to 1.63%. As for the key data ahead, the market expects that April CPI will rise 0.2%, ''which will push the year-ended pace to 3.6% on base effects,'' analysts at Westpac explained.
Elsewhere, the April monthly budget statement deficit is on tap and we will also hear from the Federal reserve's Vice Chair Clarida who will talk on the US economic outlook.
Gold forecast technical analysis
Meanwhile, as per the prior analysis, the price did indeed correct to the 38.2% Fibonacci level as follows:
Prior analysis, daily chart
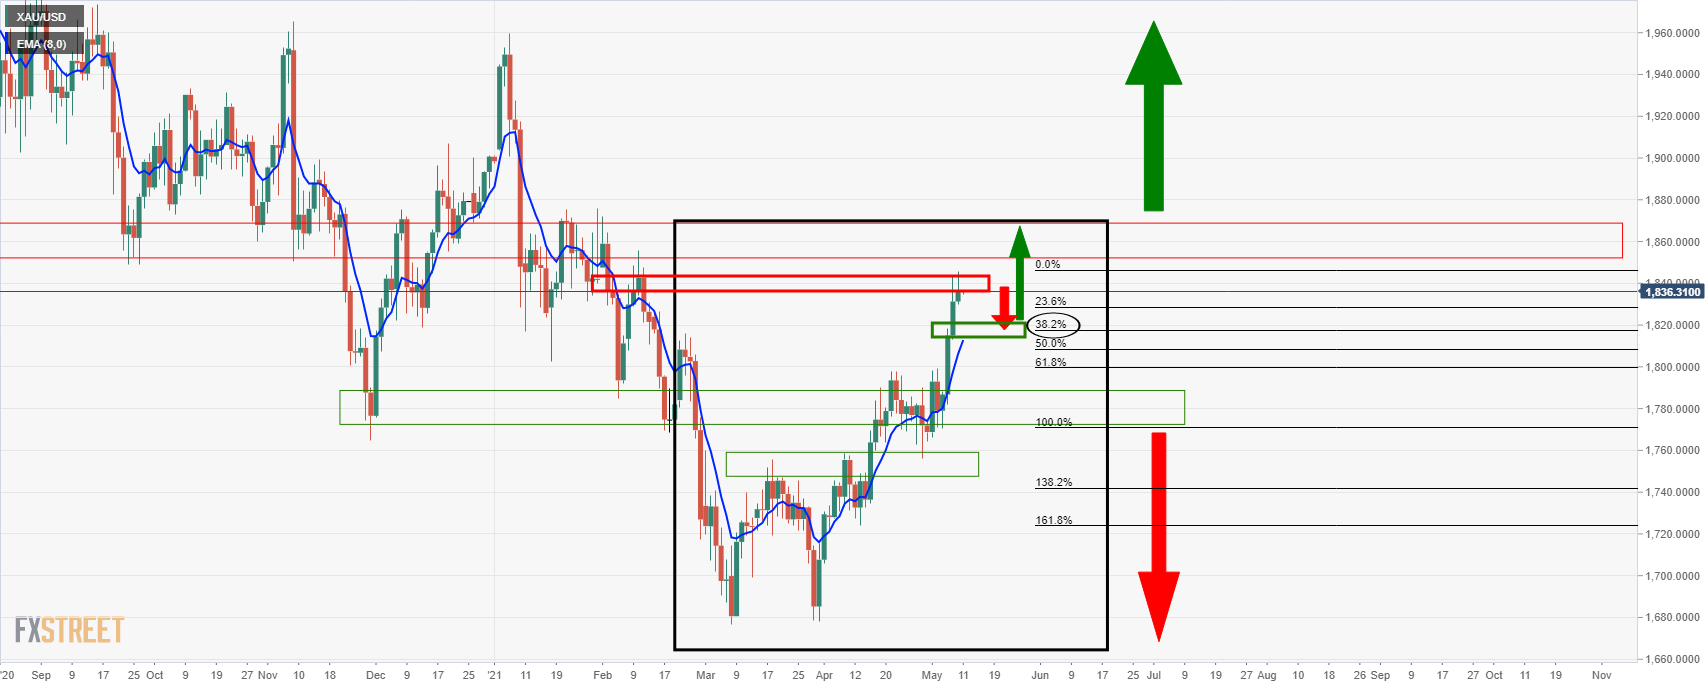
As pointed out, the current bullish leg is somewhat overextended and the daily chart illustrates just that.
A correction to at least a 38.2% Fibo that meets structure on the lower time frames, such as the 4-hour chart, would have a confluence with the 8 EMA.
If bulls step in there, then it could be the making for an onwards daily bullish market to test deeper into the monthly supply zone, with 1,850 the first port of call.
Live market, daily chart - 12 May 2021
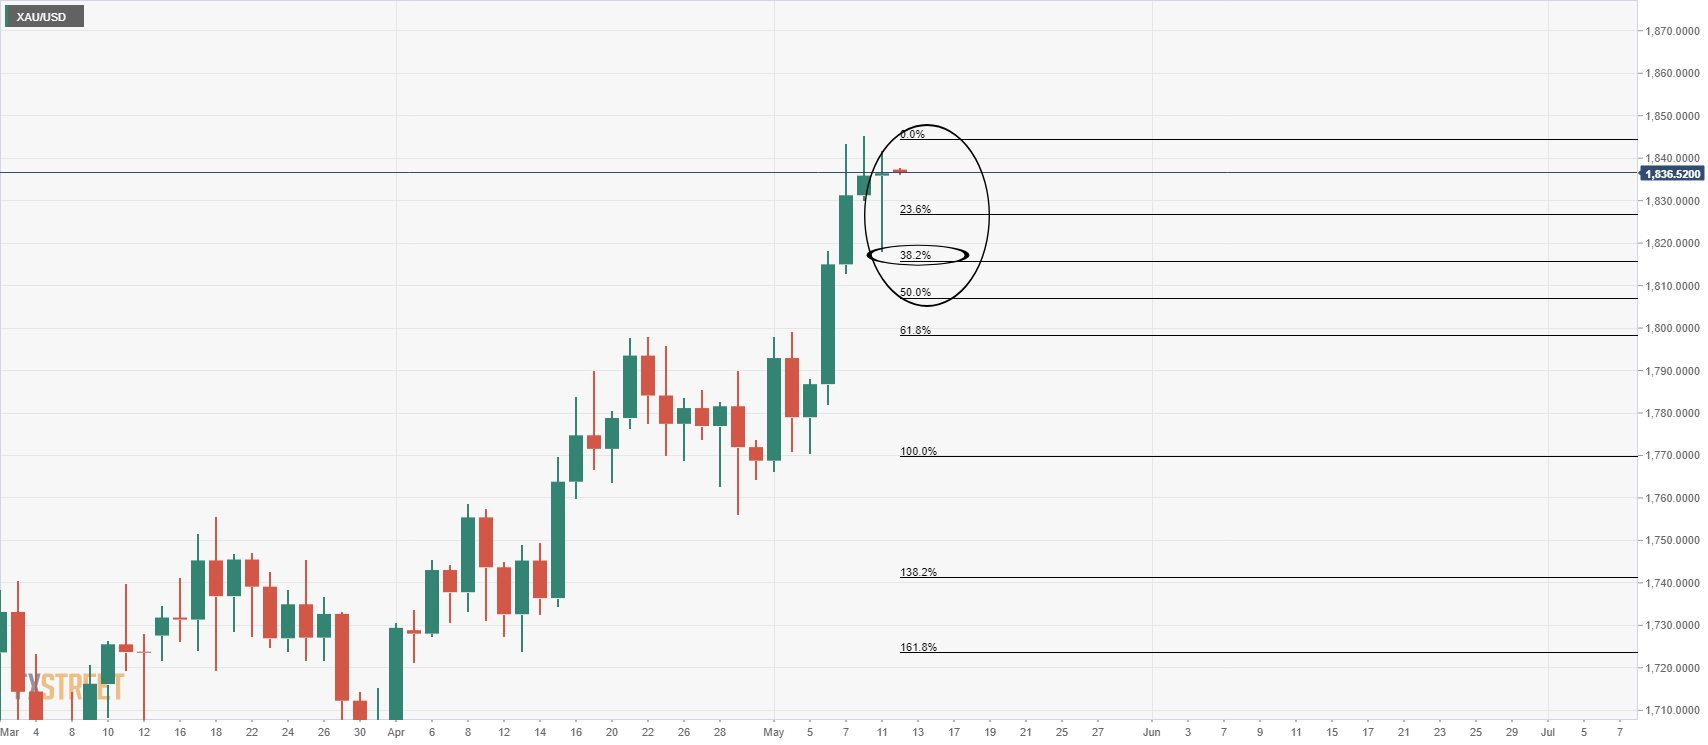
As illustrated, there was a perfect touch of the level.
However, the bears may not have thrown in the towel just yet and the lower time frames can be monitored for bearish structure.
Gold 4-hour chart
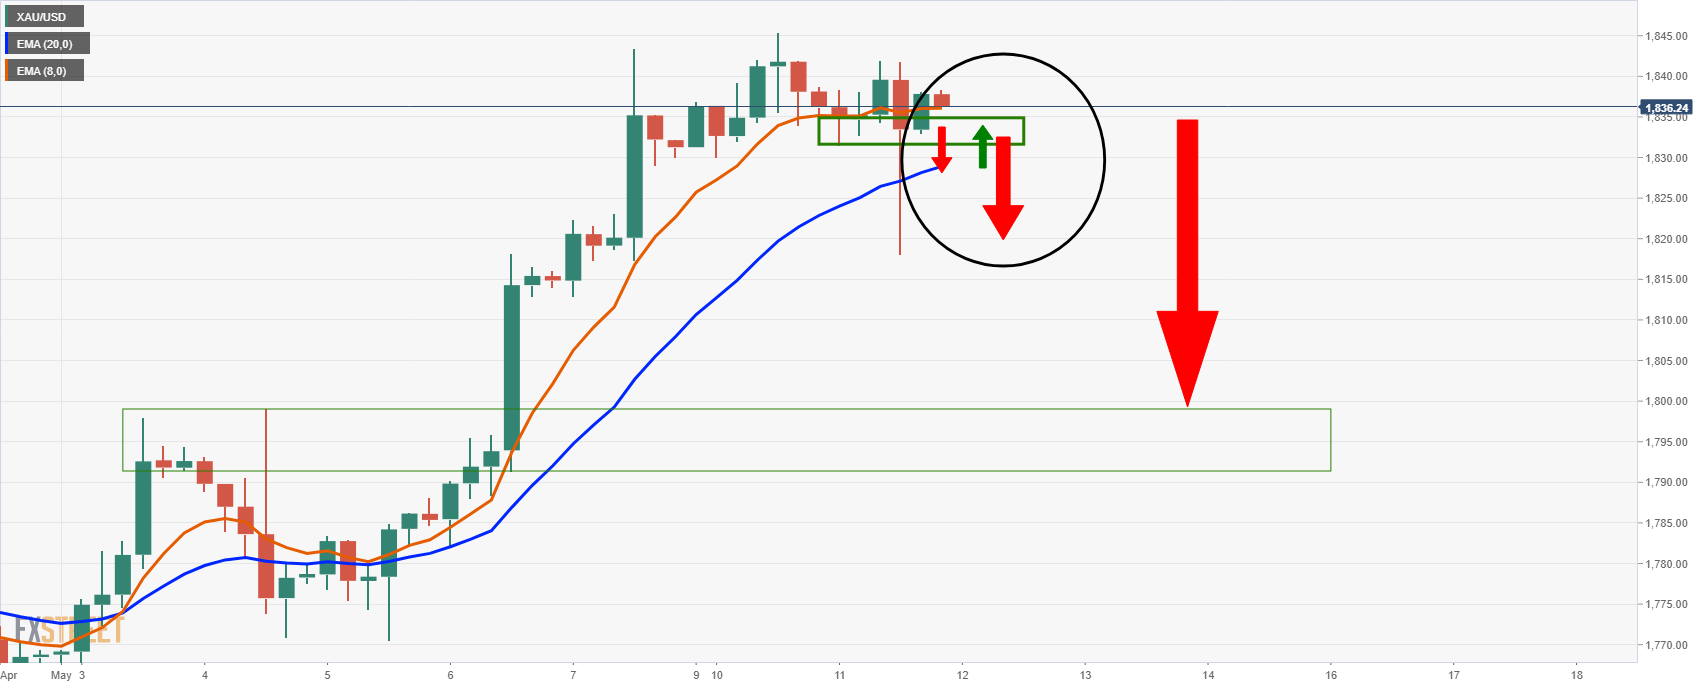
The price of gold is in a bullish environment on the 4-hour time frame, so a continuation to the upside is a more likely scenario at this juncture.
That being said, if the support breaks, the 8 and 20 EMA bearish crossover coupled with a restest of the old support, that would be expected to then act as resistance, will tip the balance in favour of the bears.
Bears could target a 61.8% Fibonacci retracement of the daily impulse that meets the prior highs and the psychological 1,800s.
Previous updates
Update: Gold reversed an early North American session dip to the $1,821 area and jumped to fresh daily tops, around the $1,838 region in the last hour. The intraday US dollar buying picked up pace in reaction to hotter-than-expected US consumer inflation figures, which, in turn, exerted some pressure on the dollar-denominated commodity. In fact, the headline CPI posted the largest rise since September 2008 and accelerated to 4.2% YoY in April. Apart from this, the core CPI also surpassed expectations and jumped 3.0% YoY from 1.6% recorded in the previous month.
The data added to the market worries that the rapid rise in inflation may be something more than transitory and could push the Fed to tighten its policy earlier than expected. This was evident from a sharp spike in the US Treasury bond yields, which was seen as another factor that drove flows away from the non-yielding yellow metal. That said, a combination of factors helped limit any further losses, rather assisted gold to attract some dip-buying at lower levels.
Gold, which is extensively used as a hedge against inflation, benefitted from the prevalent risk-off mood – as depicted by an extended selloff in the global equity markets. Against the backdrop of a shift in the Fed rate expectations, the global risk sentiment was further weighed down by an escalation of conflict between Israel and Palestinian militant group. This should continue to act as a tailwind for traditional safe-haven assets and pave the way for some meaningful upside for the precious metal.
Update: Gold price remains on the back foot around $1830, unable to clear a minor resistance near $1836 despite a pause in the US dollar’s advance. That barrier appears to be the horizontal 50-SMA on the hourly sticks. Meanwhile, the gold price remains cushioned by the ascending 100-hour SMA at $1827. The greenback trims its earlier advance heading closer to the critical US CPI data release, which is likely to set the tone for markets in the coming days.
However, escalating Middle East tensions and concerns over a potential acceleration in inflation keeps the dollar broadly bid and Treasury yields slightly on the defensive, which leaves gold prices confined in a tight range.
Update: Gold prices lose a part of the previous day gains, backed by the emergence of constructive bids against the US dollar. The rising Middle-East escalation and inflationary anxiety spooked the market participants. US Treasury yields remain elevated at 1.62% ahead of the US Consumer Price Index (CPI) data.
US inflation expectations rose to 3.4% in April, the highest in a decade amid economic reopening from covid related lockdowns. This might lead to higher prices and economic overheating, eventually, the Fed would end the ultra-loose monetary policy to curb the inflationary pressure.
Update: Gold price is dragged down, trading around $1,830. However, a big miss on US CPI may drive XAU/USD above the 200-day moving average (DMA) at $1850, FXStreet’s Dhwani Mehta informs.
See – Gold Price Analysis: XAU/USD bulls come out of the shadows to mull a test of $1850 – DBS Bank
Although risk catalysts and a busy economic calendar during the European session can direct immediate moves of the bullion, the gold traders will be more interested in the softer US CPI figures for April, expected 3.6% YoY versus 2.6% prior.
Read: US Consumer Price Index April Preview: The two base effects of inflation
Author

Ross J Burland
FXStreet
Ross J Burland, born in England, UK, is a sportsman at heart. He played Rugby and Judo for his county, Kent and the South East of England Rugby team.