Gold Weekly Forecast: XAU/USD could target 200-day SMA
- Gold extended its rally after surging above $1,800 on Thursday.
- The next target on the upside aligns at $1,850.
- A technical correction in the short-term could be witnessed.

During the first half of the week, the XAU/USD pair struggled to rise above $1,800 and fluctuated in a horizontal channel. With the greenback coming under heavy selling pressure in the second half of the week, gold gained traction and touched its highest level since February 10 at $1,843 before settling around $1,830. On a weekly basis, XAU/USD rose more than 3% and registered its largest percentage gain of 2021.
What happened last week
The data from the US showed that the business activity in the manufacturing sector continued to expand at an impressive pace with the IHS Markit’s and the ISM’s Manufacturing PMIs arriving at 60.5 and 60.7, respectively. Underlying details of these reports revealed that input price pressures continued to rise but the benchmark 10-year US Treasury bond yield lost nearly 2% on Monday and helped gold find demand. Nevertheless, XAU/USD failed to gather enough bullish momentum to break above $1,800 and erased the majority of its gains to close below $1,780 on Tuesday.
On Wednesday, Automatic Data Processing (ADP) Research announced that employment in the US private sector rose by 742,000 in April. Although this reading fell short of the market expectation of 800,000, it failed to trigger a significant market reaction. Moreover, the ISM Services PMI came in at 62.7 and reaffirmed the positive impact of the coronavirus vaccinations on the service sector.
On Thursday, the US Department of Labor said the Initial Jobless Claims dropped below 500,000 for the first time in more than a year. The positive shift witnessed in market sentiment weighed heavily on the USD and allowed gold to climb above $1,800. This action triggered a technical buying wave and provided an additional boost to the yellow metal. Reflecting the broad-based USD weakness, the US Dollar Index (DXY) lost 0.4%. Meanwhile, the Bank of England (BoE) adopted a hawkish tone in its policy statement and said that the pace of asset purchases could be slowed, making it difficult for the greenback to attract investors.
The US Department of Labor’s highly-anticipated April jobs report showed that Nonfarm Payrolls (NFP) increased by 266,000, missing the market consensus of 978,000 by a wide margin. Furthermore, the Unemployment Rate rose to 6.1% and March’s NFP got revised down to 770,000 from 916,000. The DXY slumped to its lowest level in ten weeks after these figures and fueled gold’s rally ahead of the weekend.
Next week
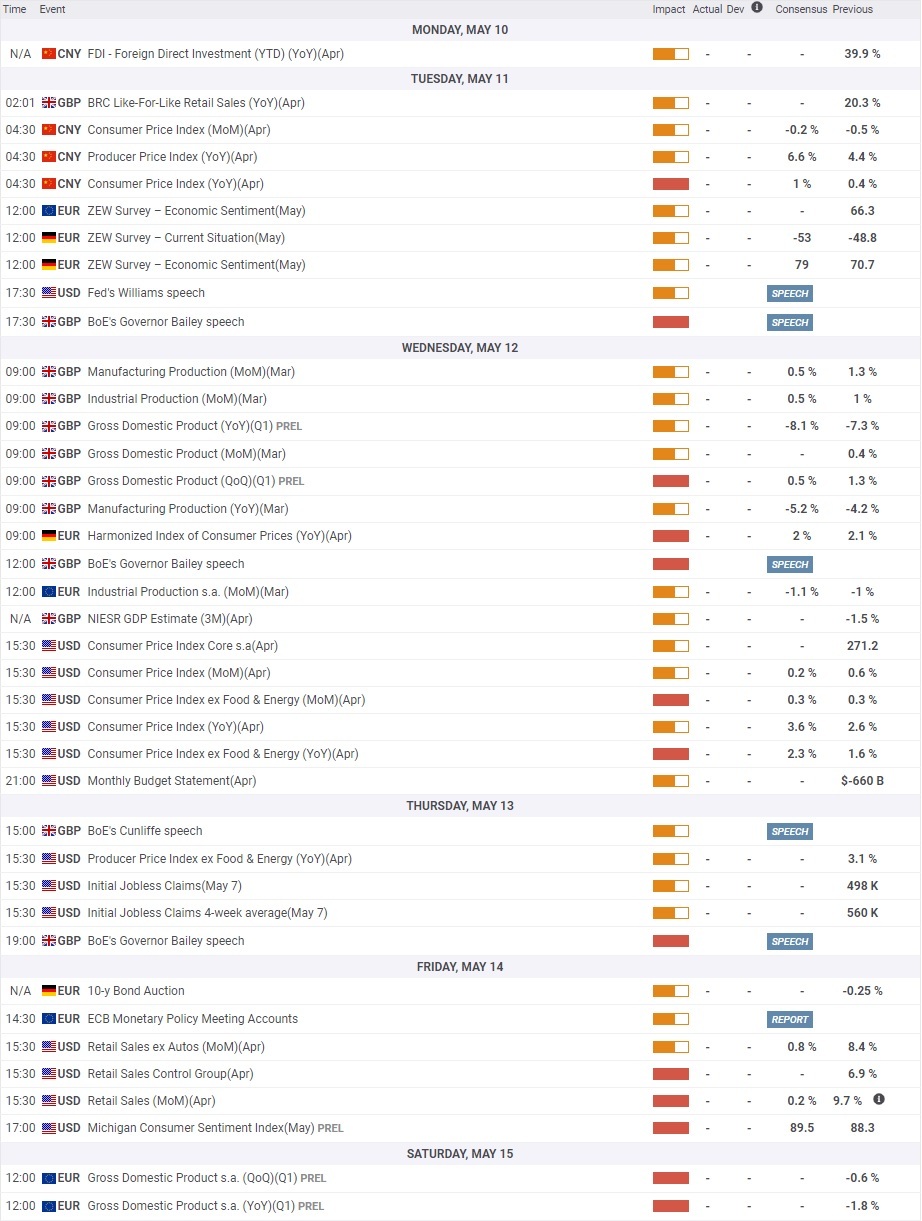
There won’t be any significant macroeconomic data releases at the start of the week and XAU/USD is likely to move in accordance with the technical picture.
On Wednesday, the Consumer Price Index (CPI) data will be watched closely by market participants. Investors expect the Core CPI, which strips volatile food and energy prices, to rise to 2.3% on a yearly basis in April. In March, the annual Core CPI climbed to 1.6%, compared to analysts’ estimate of 1.5%, and caused T-bond yields to fall sharply, suggesting that investors look for a significant jump in inflation to start pricing tapering. A reading above 2.5% could lift the USD and weigh on XAU/USD but a softer-than-expected print could trigger another selloff.
On Thursday, the weekly Initial Jobless Claims data will be featured in the US economic docket ahead of Friday’s Retail Sales figures.
Gold technical outlook
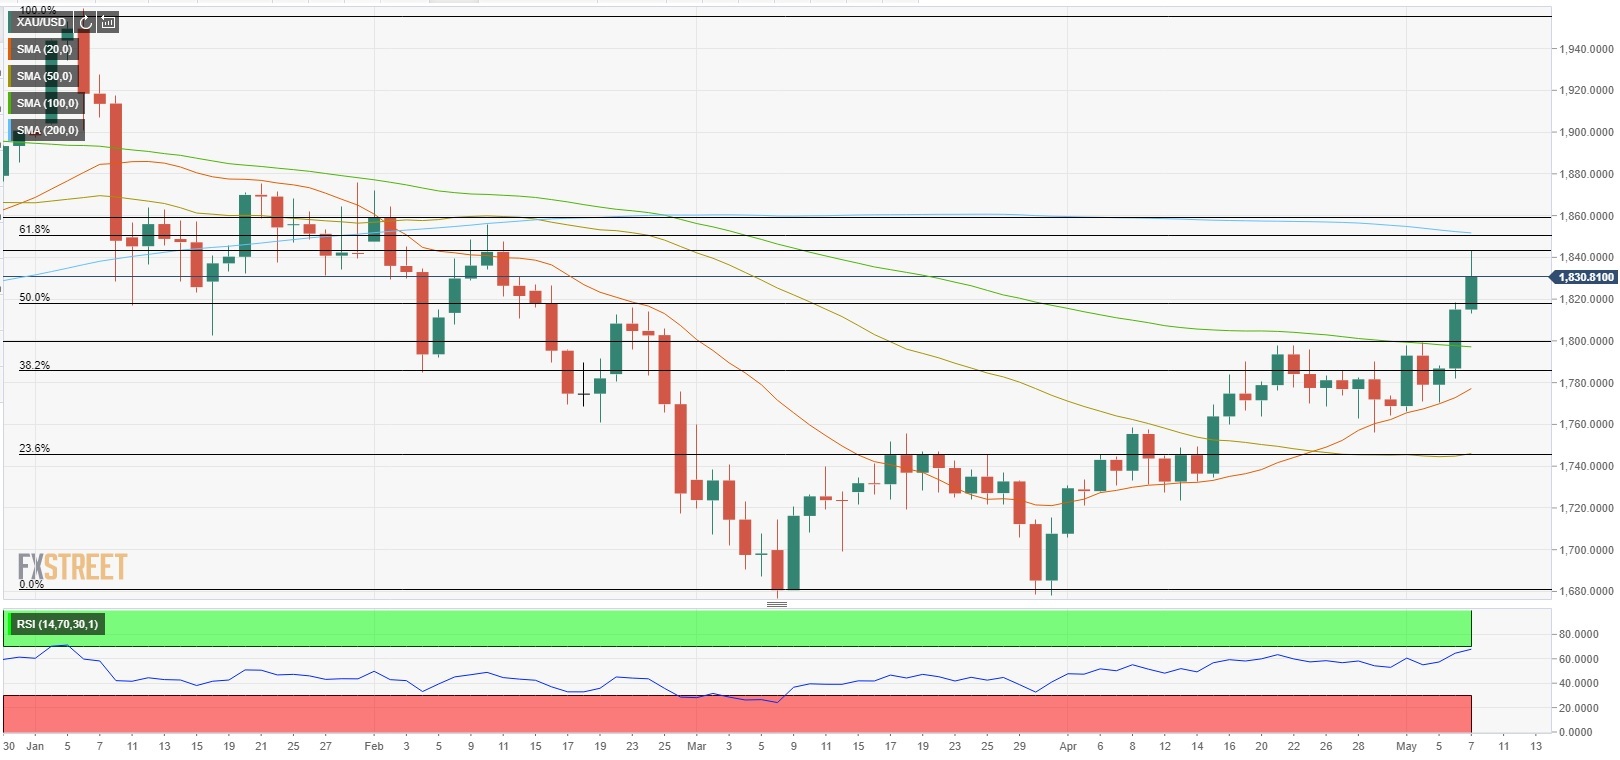
Following the two-day rally, the Relative Strength Index (RSI) on the daily chart reached 70, suggesting that XAU/USD could stage a technical correction before the next leg up.
On the downside, the initial support is located at $1,820 (Fibonacci 50% retracement of the January-March downtrend) ahead of $1,800 (psychological level, 100-day SMA). As long as XAU/USD doesn’t make a daily close below the latter, buyers are likely to remain in control. Finally, $1,785 (Fibonacci 38.2% retracement) aligns as the next support if the outlook turns bearish.
On the upside, the first obstacle lines up at $1,843 (May 7 high). Above that level, the 200-day SMA and the Fibonacci 61.8% retracement from a significant resistance at $1,850. In case gold manages to clear that hurdle, it could target $1,860 (static level).
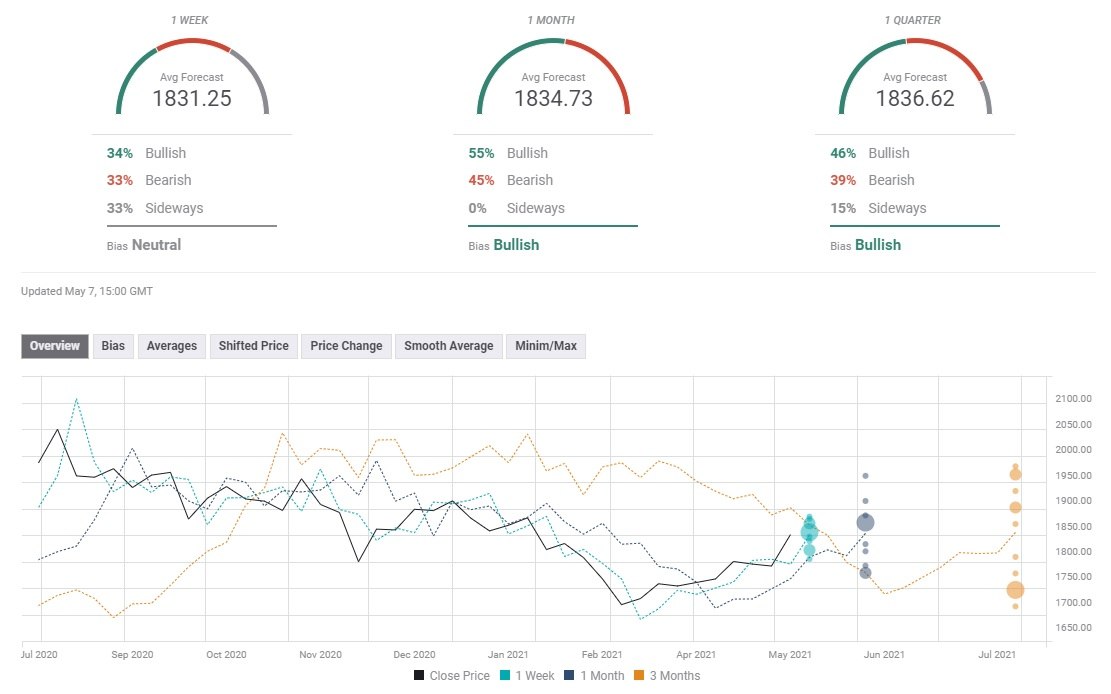
Gold sentiment poll
Despite the sharp upsurge witnessed in the second half of the week, the FXStreet Forecast poll paints a mixed picture in the near term with an average price target of $1,831 on a one-week view. Similarly, the one-month view suggests that gold is expected to stay in a consolidation phase above $1,800.
Author

Eren Sengezer
FXStreet
As an economist at heart, Eren Sengezer specializes in the assessment of the short-term and long-term impacts of macroeconomic data, central bank policies and political developments on financial assets.


