|

Zilliqa price faces short-term selling pressure as bears target $0.04

  • Zilliqa price could be on the verge of a sell-off, according to various indicators.
  • The digital asset is up by more than 200% since November.

Zilliqa had a major bull rally in the past two months, climbing from a low of $0.016 at the beginning of November to a new 2020-high at $0.054, established on December 19. Now, the digital asset seems to be poised for a correction before resuming its uptrend.

Zilliqa price remains inside a daily uptrend but faces short-term selling pressure

On the daily chart, the TD Sequential indicator presented a sell signal on December 20 which hasn’t been confirmed just yet. Additionally, the RSI has hit overextended levels for the first time since November 25, when ZIL experienced a significant sell-off.
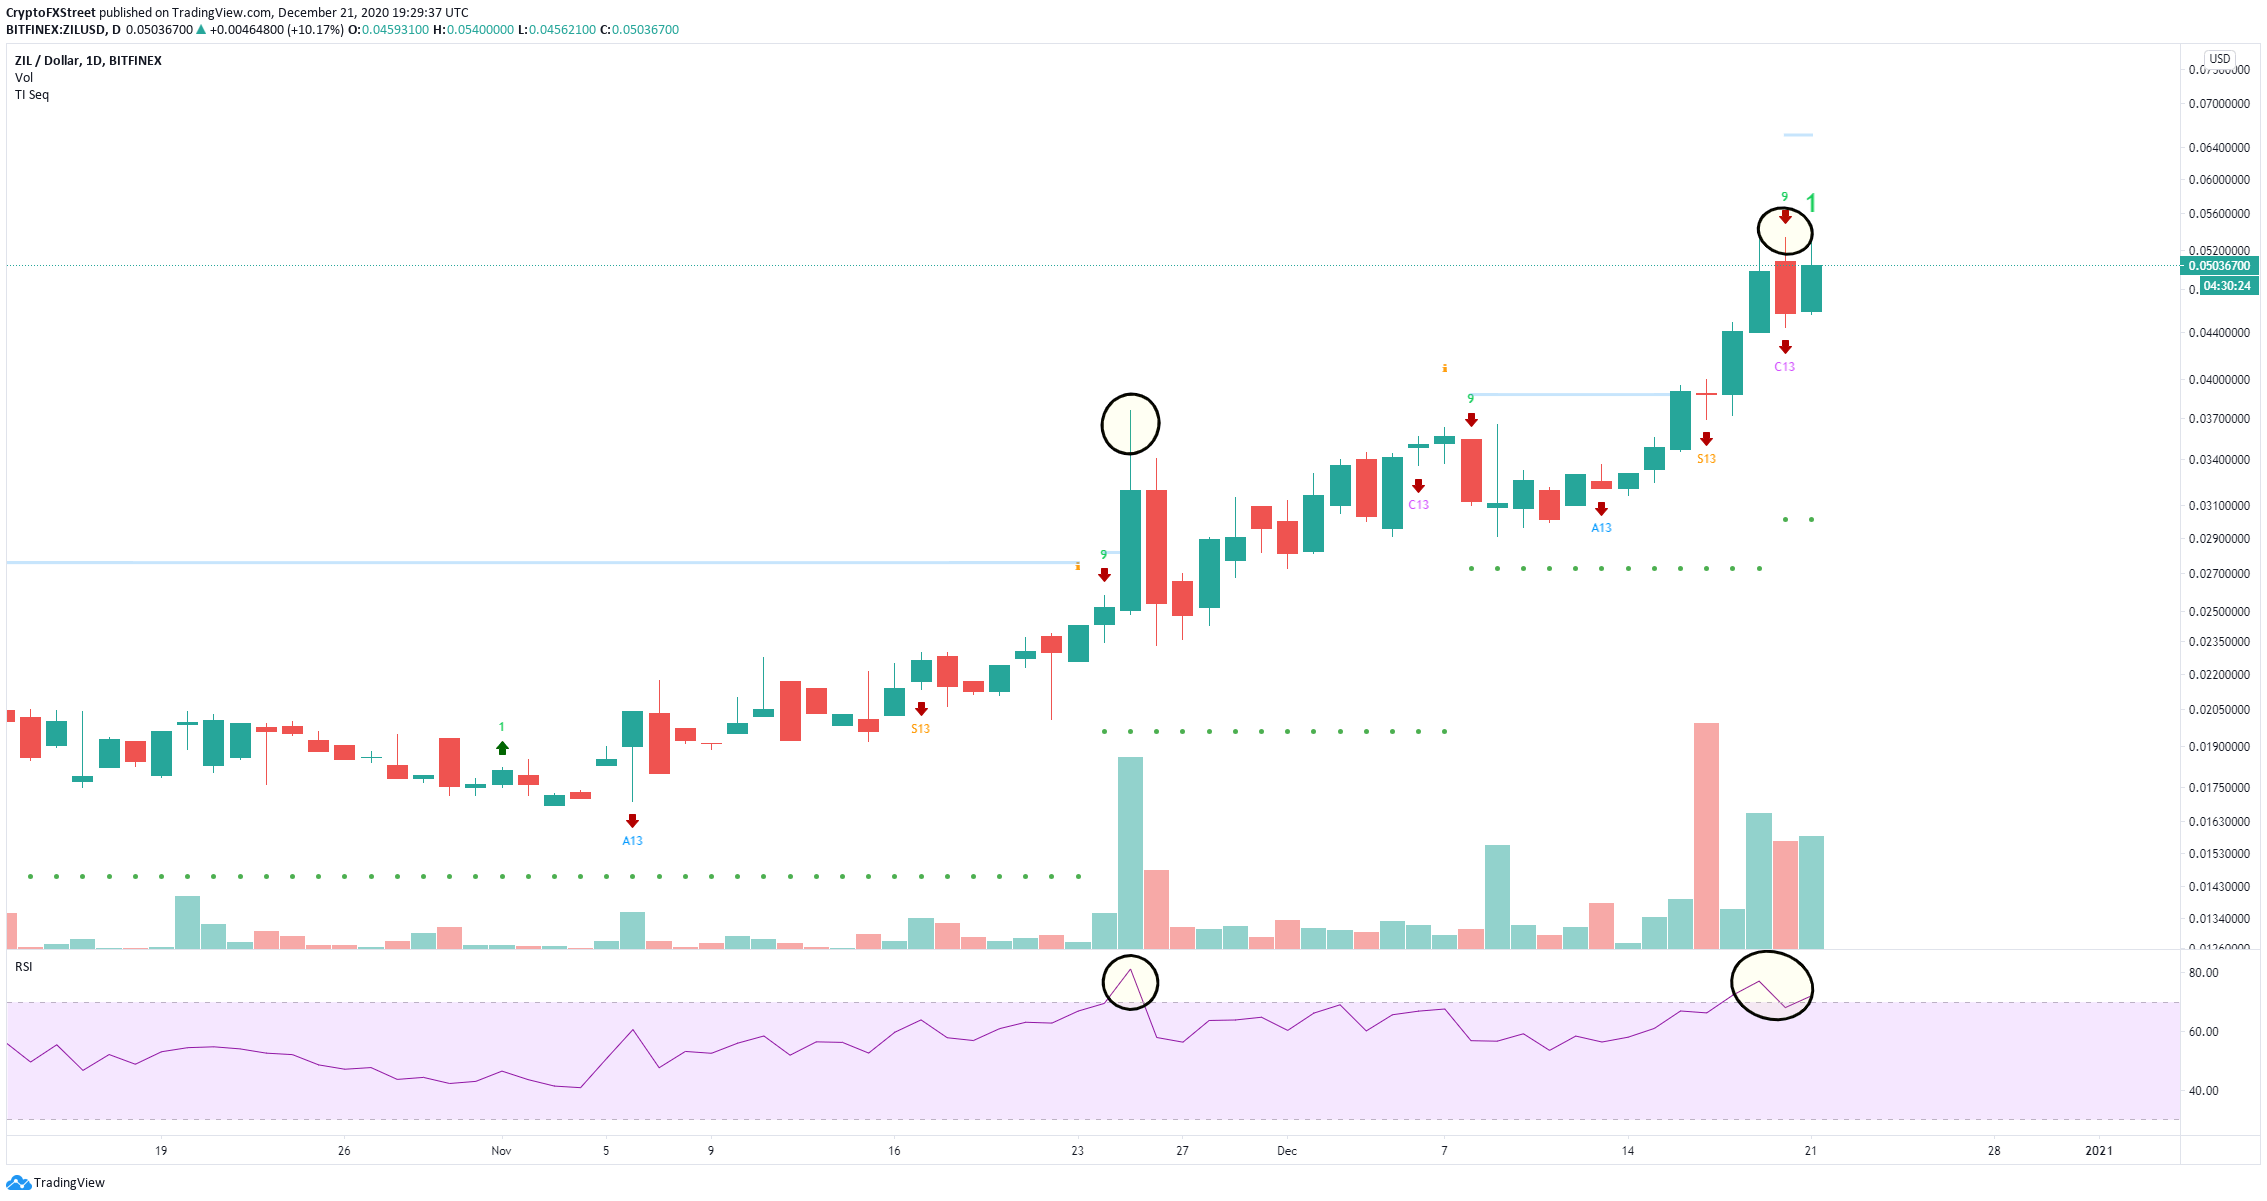
zil price

ZIL/USD daily chart

Considering how extended the daily chart is, Zilliqa price seems bounded for a correction down to the next psychological level at $0.04. Nonetheless, bulls are still in control over most time frames.

zil price

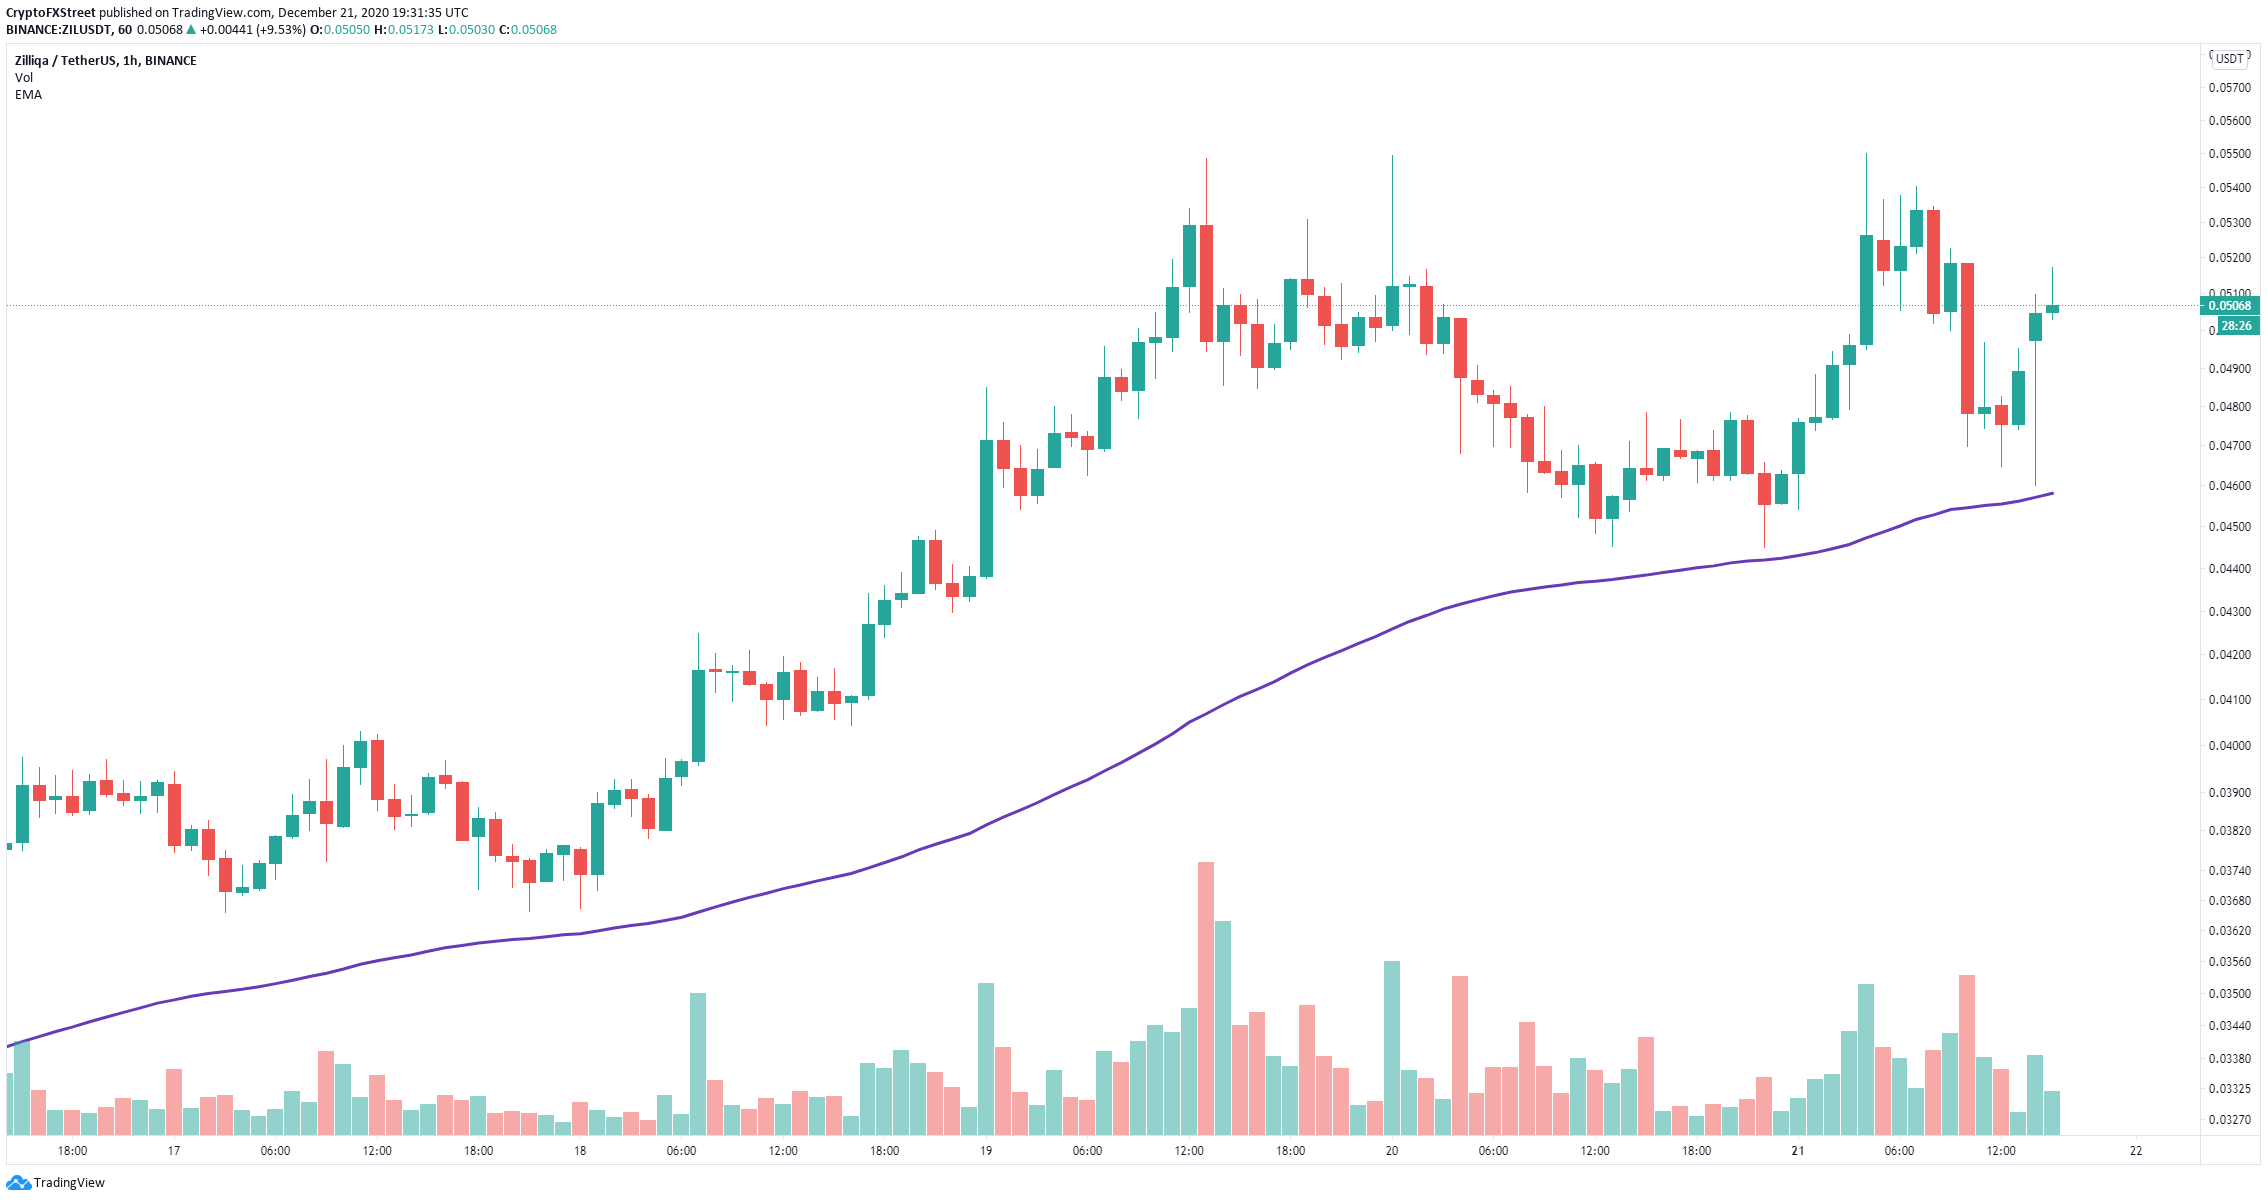
ZIL/USD 1-hour chart

On the hourly chart, the uptrend remains intact as bulls have defended the 100-EMA several times in a row in the past two days. The next clear resistance level is the high at $0.054. A breakout above this point can quickly drive Zilliqa price towards $0.06.

Author

Lorenzo Stroe

Lorenzo Stroe

Independent Analyst

Lorenzo is an experienced Technical Analyst and Content Writer who has been working in the cryptocurrency industry since 2012. He also has a passion for trading.

More from Lorenzo Stroe
Share:

Editor's Picks

Ripple bulls defend key support amid waning retail demand and ETF inflows

XRP ticks up above $1.40 support, but waning retail demand suggests caution. XRP attracts $4 million in spot ETF inflows on Thursday, signaling renewed institutional investor interest.

Crypto Today: Bitcoin, Ethereum, XRP rebound as risk appetite improves

Bitcoin rises marginally, nearing the immediate resistance of $68,000 at the time of writing on Friday. Major altcoins, including Ethereum and Ripple, hold key support levels as bulls aim to maintain marginal intraday gains.

Bitcoin Weekly Forecast: No recovery in sight 

Bitcoin price continues to trade sideways between $65,729 and $71,746, extending its consolidation since February 7. US-spot ETFs record an outflow of $403.90 million through Thursday, pointing to the fifth consecutive week of withdrawals.

Pi Network Price Forecast: PI recovery stalls amid profit-taking

Pi Network tests 50-day EMA support on Friday, after a 5% decline the previous day. PiScan data shows large deposits on CEXs totaling over 4 million PI tokens in the last 24 hours, reflecting an exodus of investors taking profits.

Bitcoin Price Annual Forecast: BTC holds long-term bullish structure heading into 2026

Bitcoin (BTC) is wrapping up 2025 as one of its most eventful years, defined by unprecedented institutional participation, major regulatory developments, and extreme price volatility.

Bitcoin: No recovery in sight

Bitcoin (BTC) price continues to trade within a range-bound zone, hovering around $67,000 at the time of writing on Friday, and falling slightly so far this week, with no signs of recovery.