|

Zilliqa price bounded inside two critical levels ready for a 23% breakout

  • Zilliqa price is trading inside an ascending parallel channel on the 4-hour chart.
  • The digital asset is right in the middle of the pattern and awaits a clear breakout or breakdown.

Zilliqa price has been trading in a short-term uptrend since the beginning of November and it’s close to the 2020-high of $0.036 again. The digital asset needs to see a clear breakout to hit a new high by the end of 2021. 

Zilliqa price keeps the bullish momentum

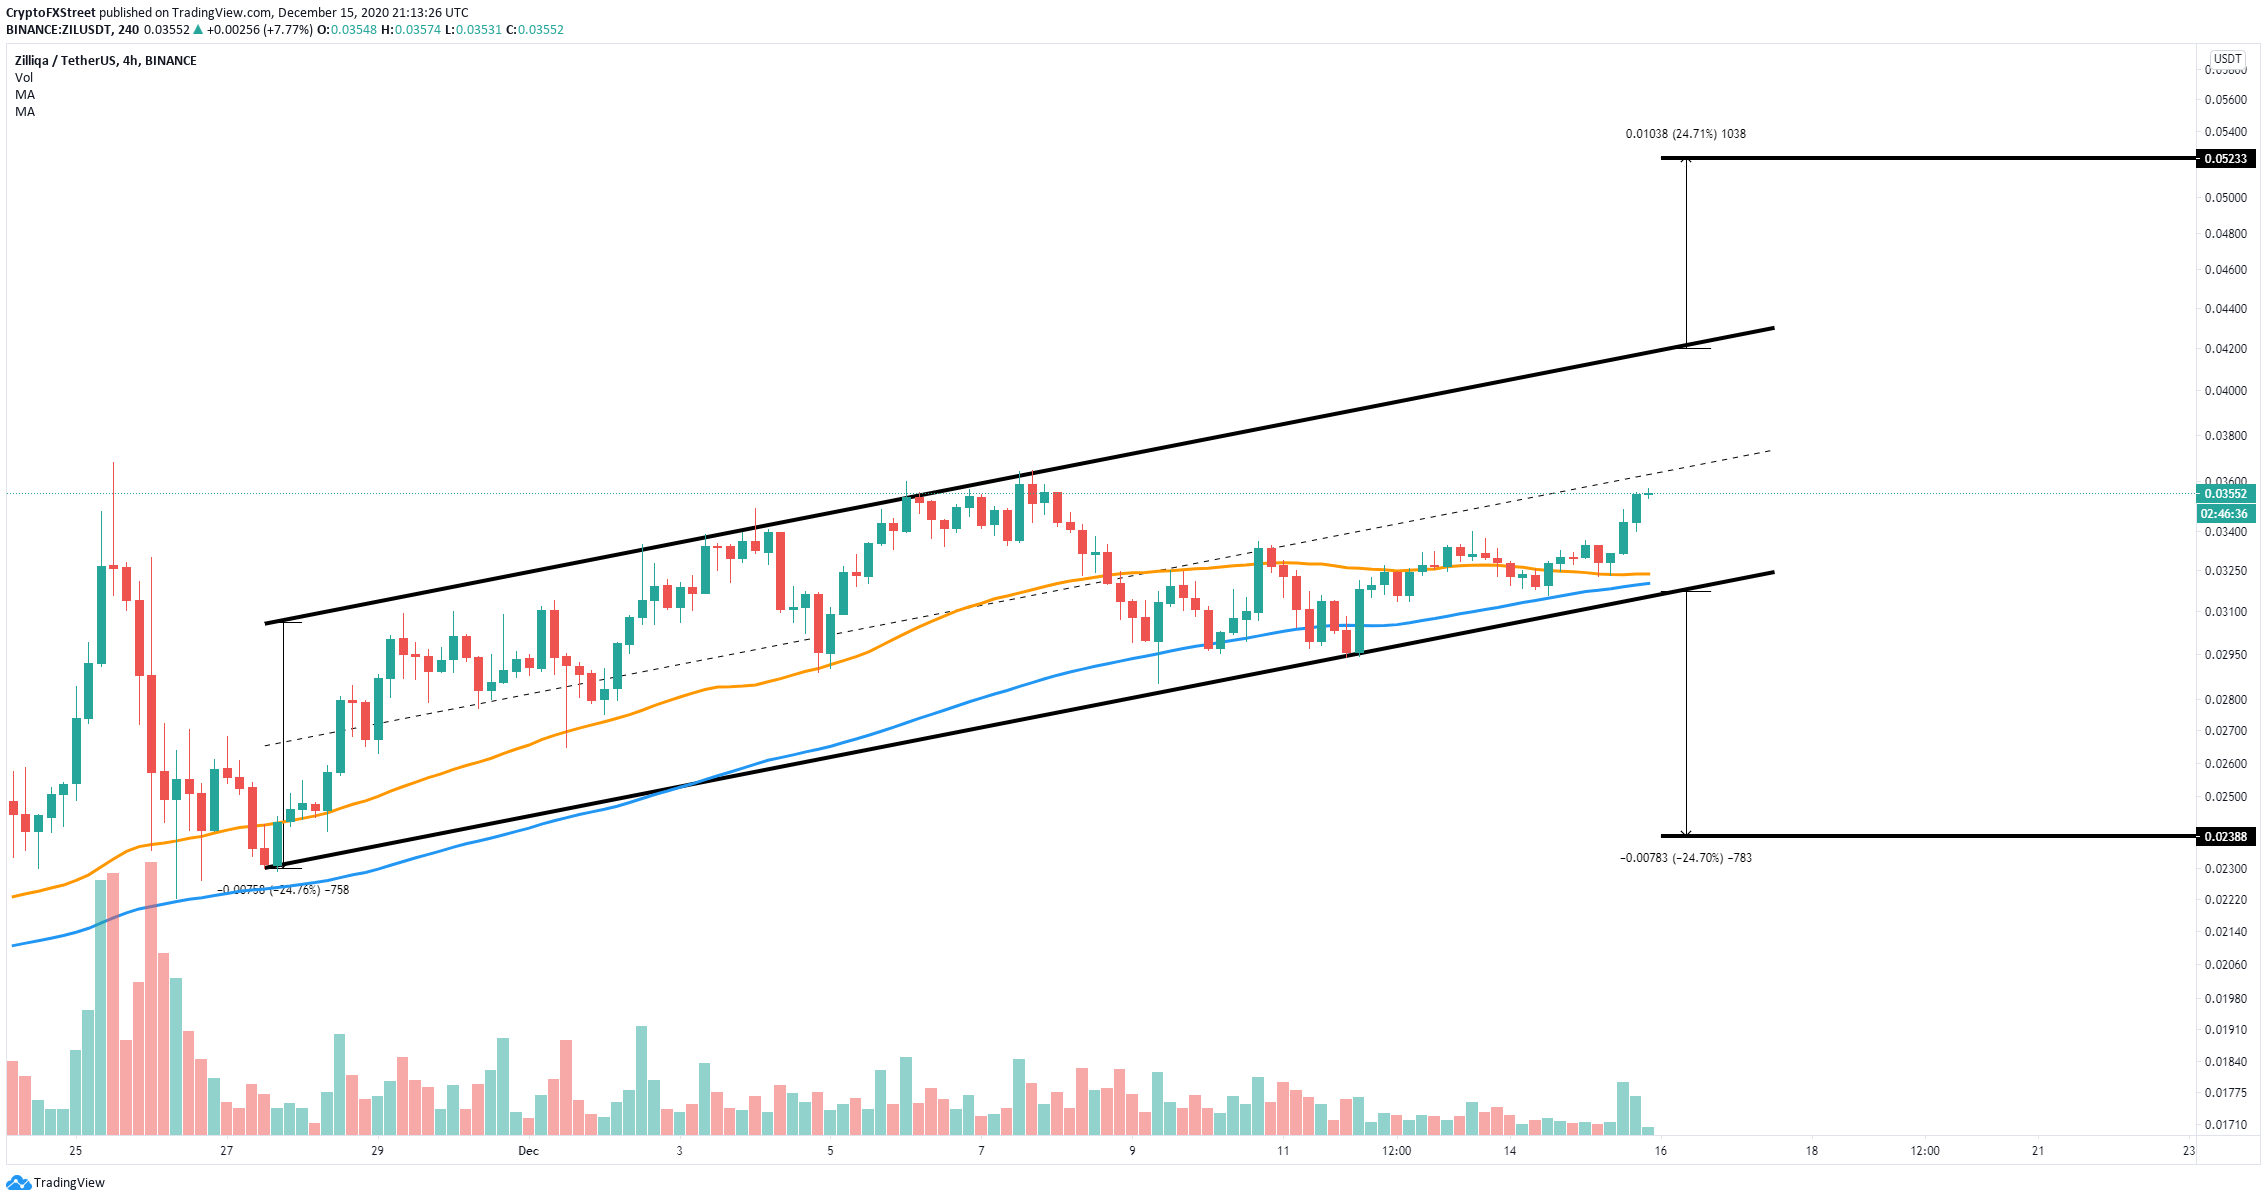
After defending the lower trendline of the ascending parallel channel on the 4-hour chart, the bulls managed to push Zilliqa price above the 50-SMA and the 100-SMA, turning both into support levels and keeping control of the trend.
zil price

ZIL/USD 4-hour chart

The digital asset has bounced notable from the bottom of the pattern and aims for the upper trendline at $0.042. A breakout above this level would quickly push ZIL towards $0.052 in the long-term.
zil price

ZIL/USD 4-hour chart

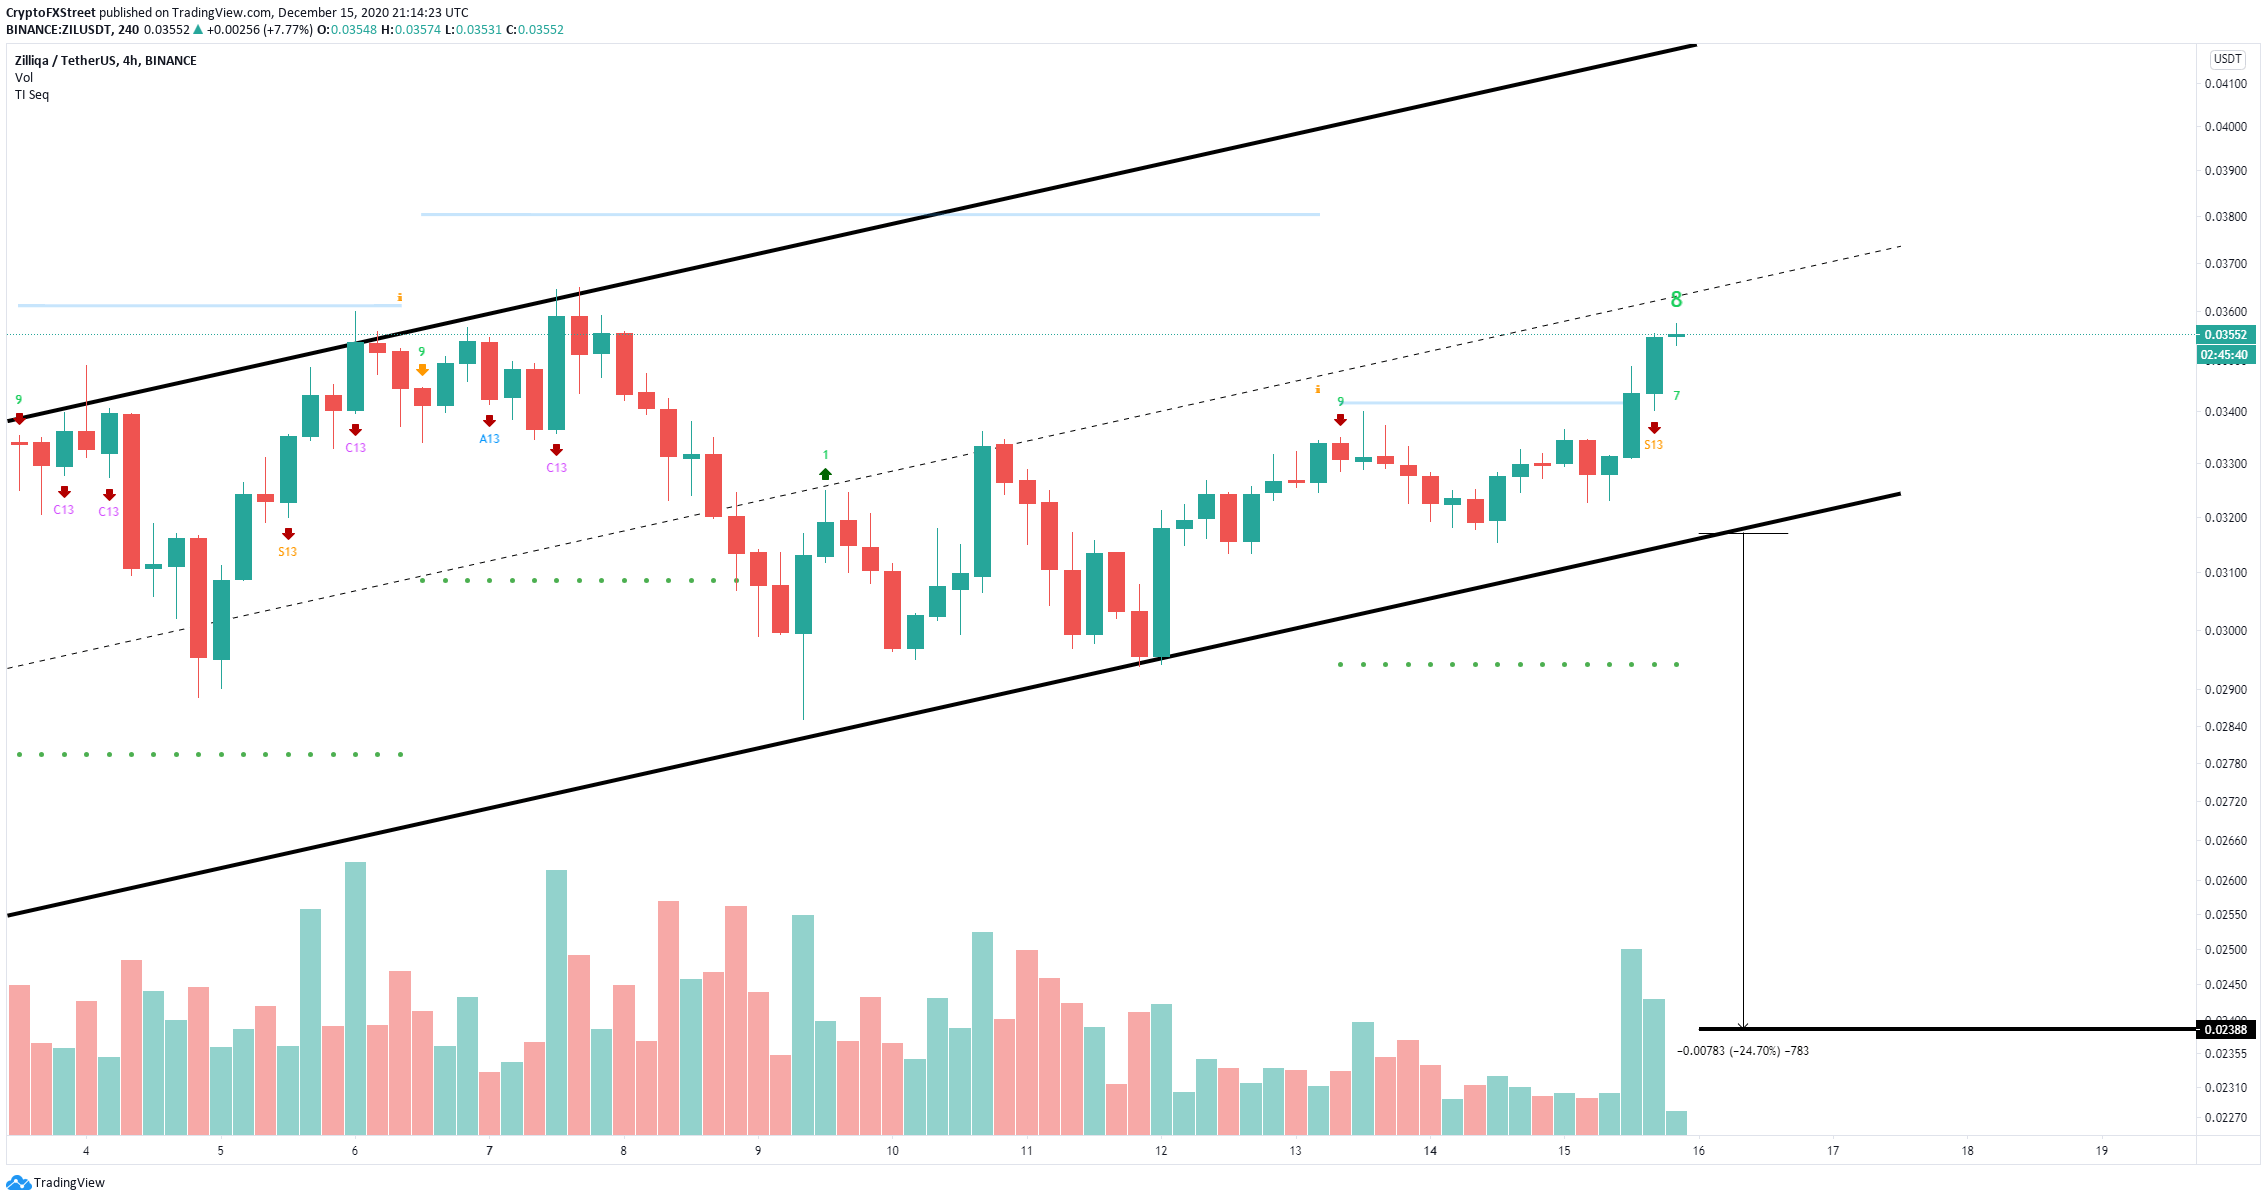
On the other hand, the TD Sequential indicator is on the verge of presenting a sell signal in the form of a green ‘9’ candle on the 4-hour chart. Validation of this call can drive ZIL towards the lower trendline of the pattern. A breakdown below $0.031 can push Zilliqa price to $0.023. 

Author

Lorenzo Stroe

Lorenzo Stroe

Independent Analyst

Lorenzo is an experienced Technical Analyst and Content Writer who has been working in the cryptocurrency industry since 2012. He also has a passion for trading.


More from Lorenzo Stroe
Share:

Editor's Picks

XRP slides amid a fragile crypto market structure
Ripple (XRP) falls for the second straight day, trading at $1.37 on Thursday. The broader cryptocurrency market remains fragile as investors weigh the impact of geopolitical tensions in the Middle East, which triggered persistent increases in Crude Oil prices while restricting shipping through the Straight of Hormuz and the Red Sea.
Bitcoin Price Forecast: BTC pressured amid ETF outflows, fresh US-Iran risks
Bitcoin (BTC) remains under pressure, trading below $78,200 at the time of writing on Thursday after declining nearly 3% so far this week. Weakening institutional demand, along with escalating geopolitical tensions between the US and Iran near the Strait of Hormuz, continues to dampen risk appetite and weigh on the Crypto King. Institutional demand for Bitcoin shows early signs of caution.
Top Altcoins Price Forecast: Ripple, Solana, and Cardano risk deeper losses
Ripple (XRP), Solana (SOL), and Cardano (ADA) struggle to extend last month's advance, pointing to moderating buying pressure. The technical outlook for XRP, SOL, and ADA suggests a mild near-term bearish bias as momentum weakens. Ripple trades around $1.3800 at press time on Thursday, extending losses after a bearish close the previous day.
Crypto Today: Bitcoin, Ethereum and XRP lose bullish momentum as structural support holds
Cryptocurrency prices are moderating on Thursday, with Bitcoin (BTC) dropping to test the near-term $78,000 support. Altcoins, including Ethereum (ETH) and Ripple (XRP), are echoing Bitcoin’s cautious sentiment, with ETH retracing to approximately $2,470 and XRP to $1.38.
Bitcoin: Gearing up for a sharp move
Bitcoin (BTC) is trading around $81,000 on Friday, up over 4% so far this week, and awaits a key catalyst that could determine its next directional move. Strong institutional demand is supporting the bullish price action, with spot BTC Exchange Traded Funds (ETFs) on track to record a third straight week of inflows.