Why Investors may want to watch Bitcoin price for a 10% move
- Bitcoin price consolidates at $19,000 while bulls repair its technical structure.
- A symmetrical triangle pattern on the eight-hour chart hints at a 10% bullish breakout to $20,915.
- Bitcoin price’s impending breakout could delay due to low trading volume on Sunday.

Bitcoin price is pivoting around $19,000 as it collects liquidity for its next move. This week’s trading was marred with challenging external forces from the United Kingdom’s Bank of England (BoE) and the United States Federal Reserve (Fed).
The latter hiked interest rates by 0.75%, with Jerome Powell, the Fed chair, reiterating that inflation must be combated. Although the BoE announced slightly less strict measures, its 0.50% hike saw interest rates spike to a 14-year high.
Bitcoin price and the crypto market have been feeling the pinch as investors shun risky assets. In other words, there isn’t just enough demand behind BTC for a rally despite analysts calling a floor price around $18,000.
Read more: Bears punch holes in Bitcoin price technical structure amid a glaring recession in the UK
Can traders squeeze in more gains from Bitcoin price?
Bitcoin bulls have a challenging task–defending the $19,000 inflection point. On the upside, a breakout is on the horizon following the formation of a symmetrical triangle pattern. The upper falling trendline shows sellers are not ready to let off Bitcoin price. However, the pattern’s ascending trend line cements buyers’ presence in the market.
As shown by the OBV (On Balance Volume) indicator, low trading volume signifies consolidation – and is synonymous with triangle breakouts.
The Moving Average Convergence Divergence (MACD) indicator on the same four-hour chart flaunts a positive outlook. Bitcoin price’s 10% breakout above the triangle will gain traction as the MACD moves closer to the mean line. Movement into the positive region (above the mean line) would confirm BTC’s optimistic outcome.
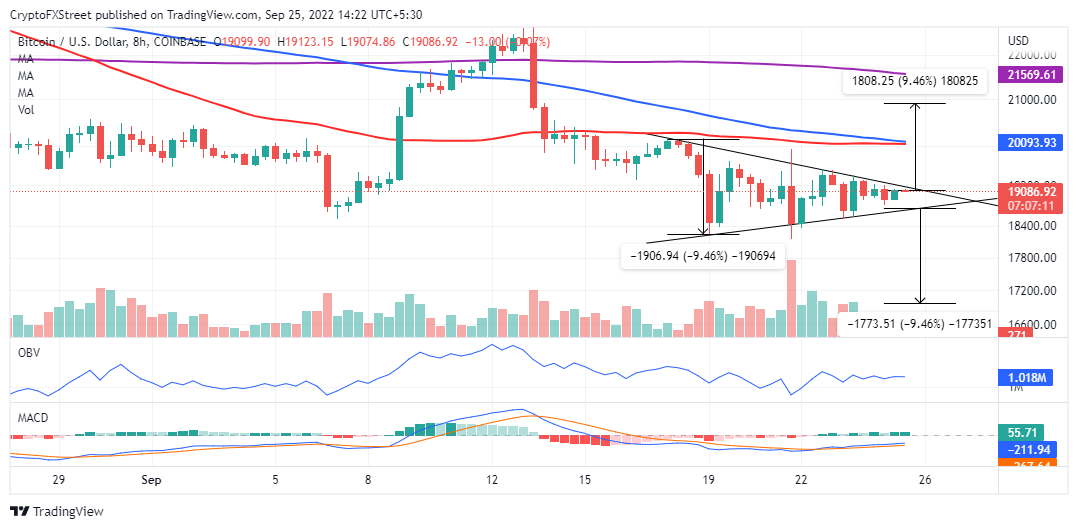
BTC/USD four-hour chart
The IOMAP on-chain model by IntoTheBlock (ITB) presents a conflicting outlook, as observed in the chart below. As Bitcoin price lifts toward its triangle target at $20,915, it might encounter heavy overhead pressure stemming from the 1.09 million addresses that previously bought roughly 575,000 coins between $19,617 and $20,156.
-637996960000466122.png)
Bitcoin IOMAP model
For a bullish breakout to $20,915, Bitcoin price must use this calm period to collect enough liquidity from overpowering potential sellers. Otherwise, a recovery above $20,000 would remain a pipe dream to the extent of losses as far as $14,000.
Author

John Isige
FXStreet
John Isige is a seasoned cryptocurrency journalist and markets analyst committed to delivering high-quality, actionable insights tailored to traders, investors, and crypto enthusiasts. He enjoys deep dives into emerging Web3 tren