Can Bitcoin price manage another bounce to $21,000 this weekend?
- Bitcoin price is dancing in a narrow range between $18,000 and $19,500.
- Pressure continues to build on the crypto market as investors shun risky assets.
- Bulls must hold the fort at $18,500 to cultivate a potential symmetrical triangle breakout.

After dealing with a challenging week, Bitcoin price is finding footing at $19,000. Various unfavorable external forces curtailed recovery from support roughly at $18,000, forcing a rejection at around $19,500.
Most analysts are convinced that Bitcoin price has already touched its floor price, and the only way is to the upside. However, investors do not seem to agree and look elsewhere for opportunities amidst hiking interest rates to combat exploding inflation.
Bitcoin mining stocks bleeding seems unstoppable
Bitcoin mining stocks have continued to wallow in murky waters, largely attributed to the crypto market bear run. This week was particularly tough for most stocks globally, with the US Federal Reserve raising interest rates by 0.75%. The Bank of England (BoE) announced a slightly lower hike of 0.5% to combat the ballooning inflation against high energy and food prices.
According to a stock report by The Block, Marathon Digital Holdings, Iris Energy and Cipher Mining had fallen the most by the close of the market on Friday. Losses were generally witnessed across all Bitcoin mining stocks while BTC price doddered below the $19,000 mark.
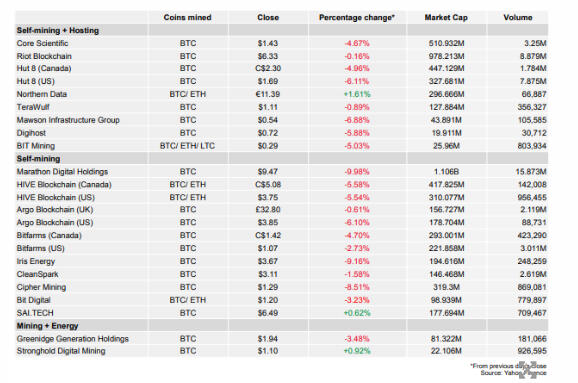
Bitcoin stocks performance chart
Since the beginning of the year, investors have cut investment budgets to risky markets, citing spiking inflation levels and a strict monetary policy. This means that while Bitcoin price may have tapped a floor price, it lacks the momentum to sustain recovery.
Meanwhile, Bitcoin price is gradually getting closer to symmetrical triangle pattern breakout, as shown on its daily chart. The direction of the potential move is still unknown; hence traders must wait for a natural break above or below the pattern.
A bullish outcome is possible, but buyers must defend the $18,500 level. The Moving Average Convergence Divergence (MACD) indicator’s buy signal adds credibility to BTC’s tentative 9.5% move to $20,914.
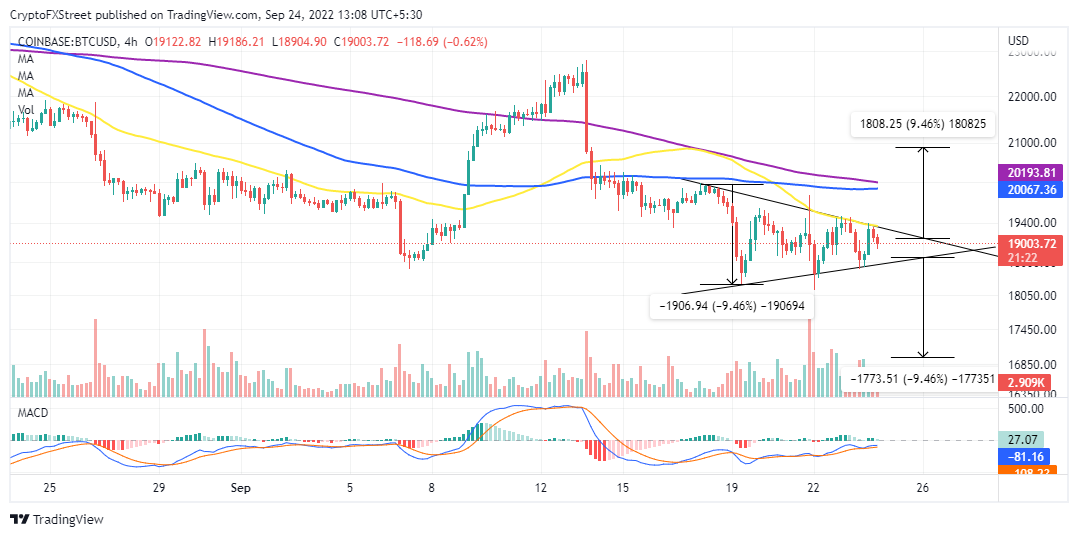
BTC/USD four-hour chart
If push comes to shove and selling pressure overwhelms buyers at $18,500, an equal opposite breakout to $16975 may come into play. Other targets on the downside are $18,050 and $17,450 for traders looking forward to shorting BTC price.
Author

John Isige
FXStreet
John Isige is a seasoned cryptocurrency journalist and markets analyst committed to delivering high-quality, actionable insights tailored to traders, investors, and crypto enthusiasts. He enjoys deep dives into emerging Web3 tren