Top 3 Price Prediction Bitcoin, Ethereum, XRP: Santa is early for Christmas as crypto markets rally
- Bitcoin price developing strongest weekly candlestick of the past ten weeks.
- Ethereum price prepped for a return to $4,500.
- XRP price triggers a bear trap and slaughters short-sellers; rally to $2.00 underway

Bitcoin price action has been on a tear, destroying short positions as bearish outlooks across the board as smashed. Ethereum price has a more difficult path than Bitcoin, but the structure is clearly bullish. XRP price enters a short-squeeze, likely liquidating many leveraged positions on unregulated derivatives platforms.
Bitcoin price poised to hit $55,000, pause, then target new all-time highs
Bitcoin price action has been phenomenal during the Christmas trading week. Spiking more than 11% so far this week with a target of a 20% upswing to end the week, the new leg higher for Bitcoin has likely begun.
Contributing to Bitcoin’s performance and an extended bullish outlook is three key events:
- New 2021 Volume Point Of Control printed at $47,500.
- Weekly bullish engulfing candlestick formed, ending the current seven-week Gann ‘death cycle’.
- Enormous hidden bullish divergence between the candlestick chart and the Composite Index.
Traders should expect a slight pause and some profit-taking near the weekly Tenkan-Sen at $55,000.
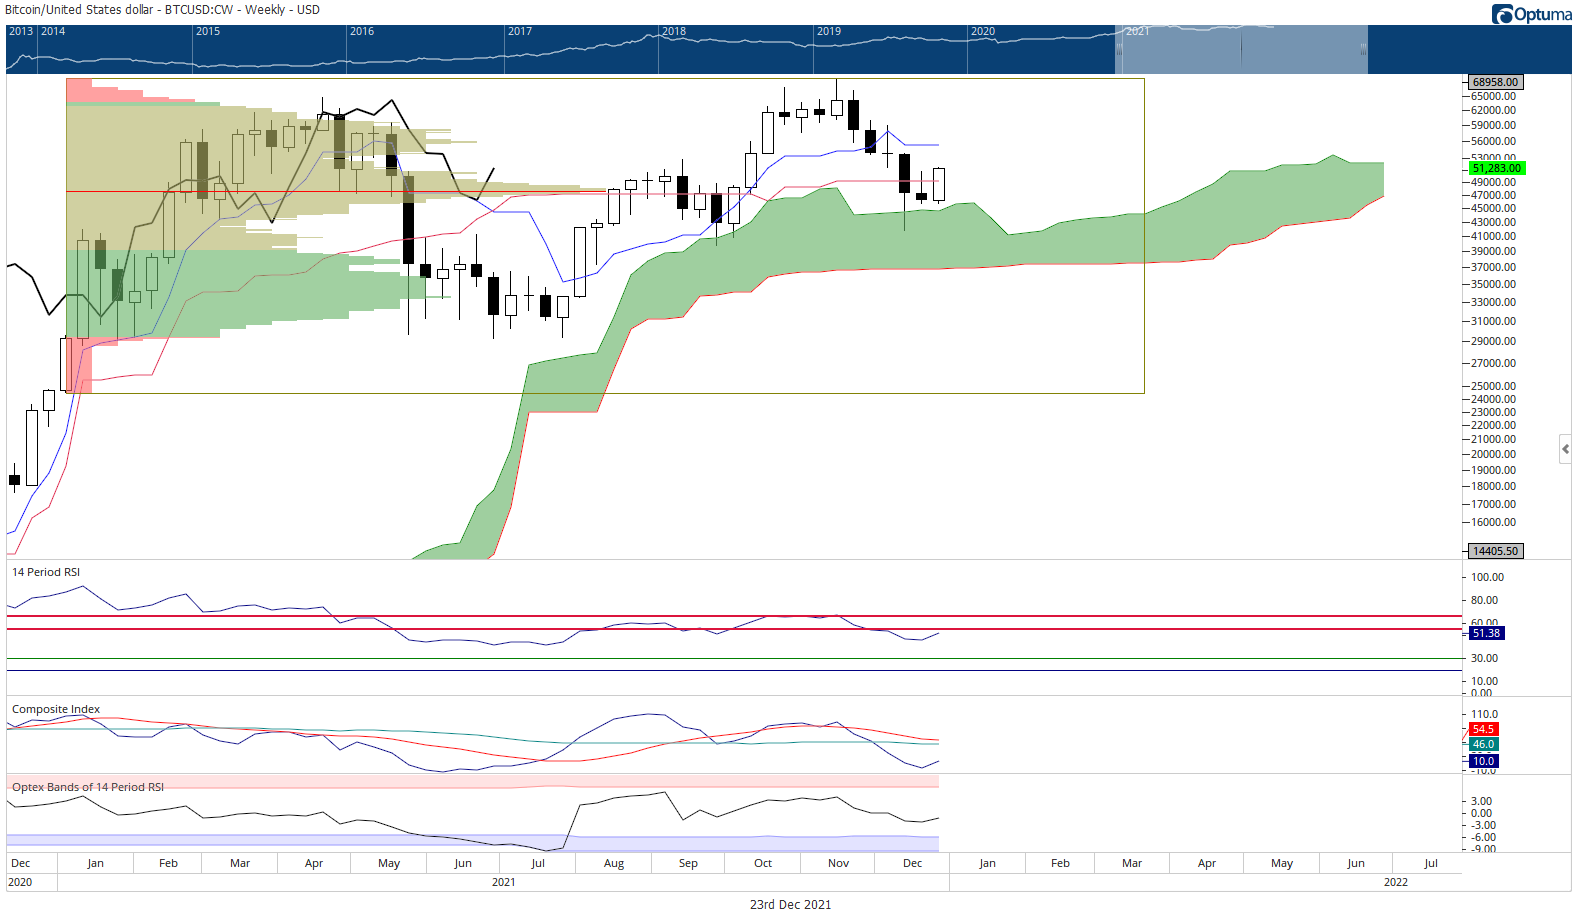
Invalidation of this bullish outlook will only occur if Bitcoin experiences a weekly close below the top of the Cloud (Senkou Span A) at or below $43,000.
Ethereum price to test resistance at $4,150 and then $4,500 before making new all-time highs
Ethereum price has two primary resistance zone up ahead. The first is a confluence zone of two Ichimoku levels at the $4,150 level: Senkou Span B (most substantial level of support/resistance in the Ichimoku system) and the Kijun-Sen. If buyers can close Ethereum above that price level, the next test is not far away.
The final resistance zone exists between $4,300 and $4,500. The top of the current bull flag, the Cloud, and 61.8% Fibonacci expansion exist within that range. If Ethereum can breach that zone, then the next move for Ethereum is new all-time highs near the $7,300 value area.
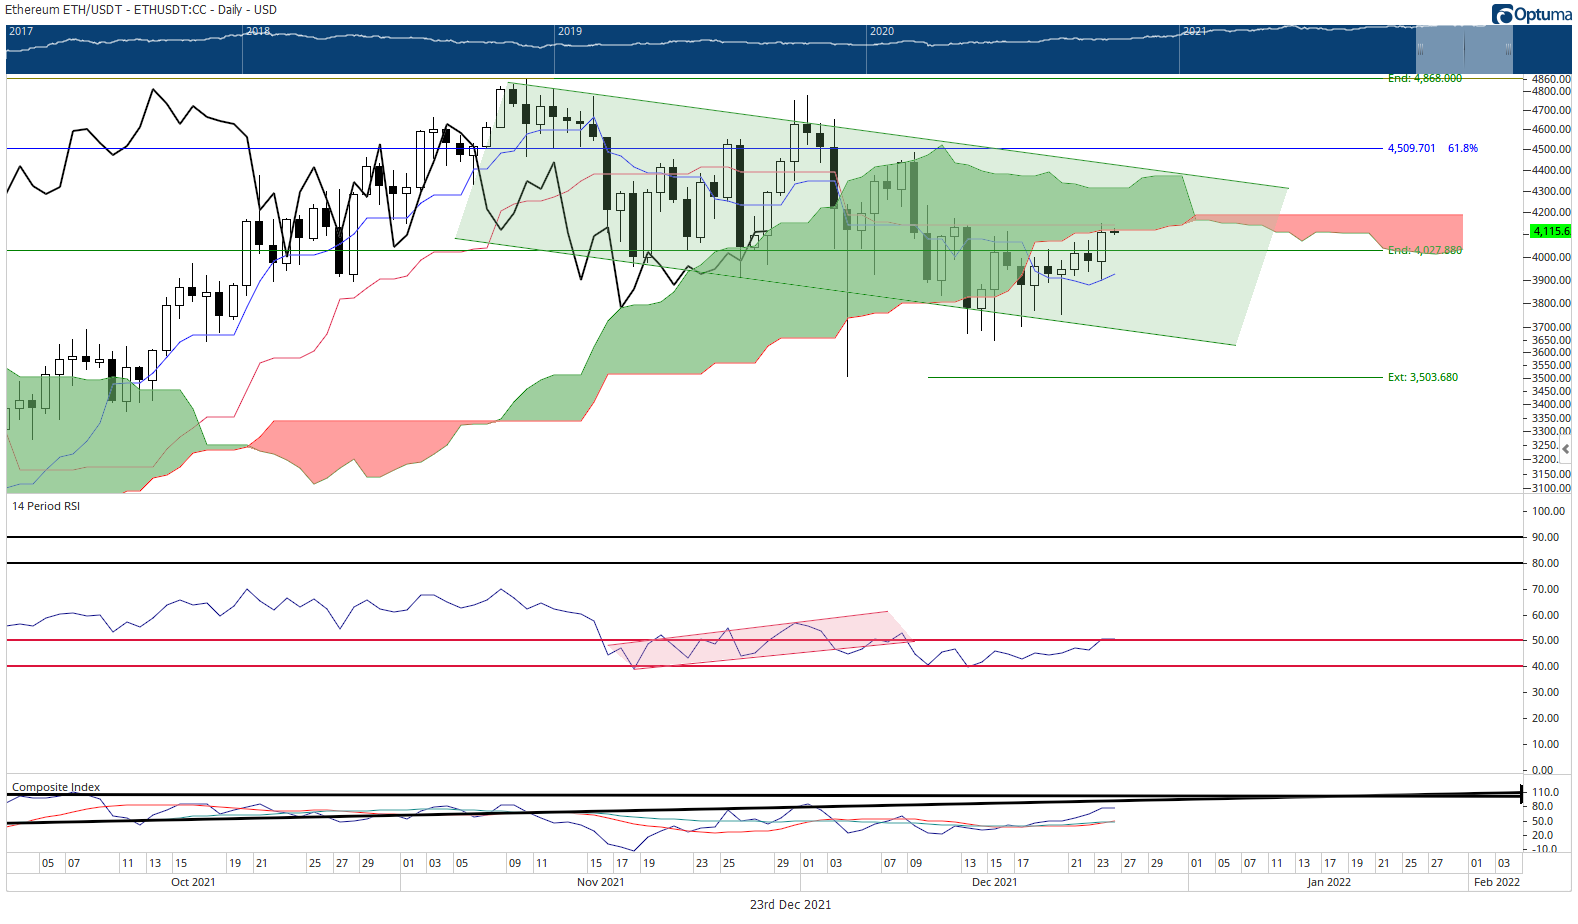
Downside risks remain as long as Ethereum is below the Cloud. For example, a close below $3,700 would probably trigger a return to the $2,800 value area.
XRP price begins massive short squeeze, the rally above $1 to $2 begins
XRP price action has been one of the more unexpected movers of the past week. Thus far, the trading range for the Christmas trading week has exceeded the highs of the past four weeks, triggering a large number of short-sellers along the way. A battle between bulls and bears near the $1 level is likely to continue, but bulls are better positioned to win that conflict.
The XRP weekly chart has one significant benefit that many altcoins do not have: a thin Ichimoku Cloud. Thin Clouds represent weakness and ease of movement. While Senkou Span B is extraordinarily flat and has been in a flat condition for thirty-six weeks, it may not behave as a significant source of resistance due to the thin nature of the overall Cloud.
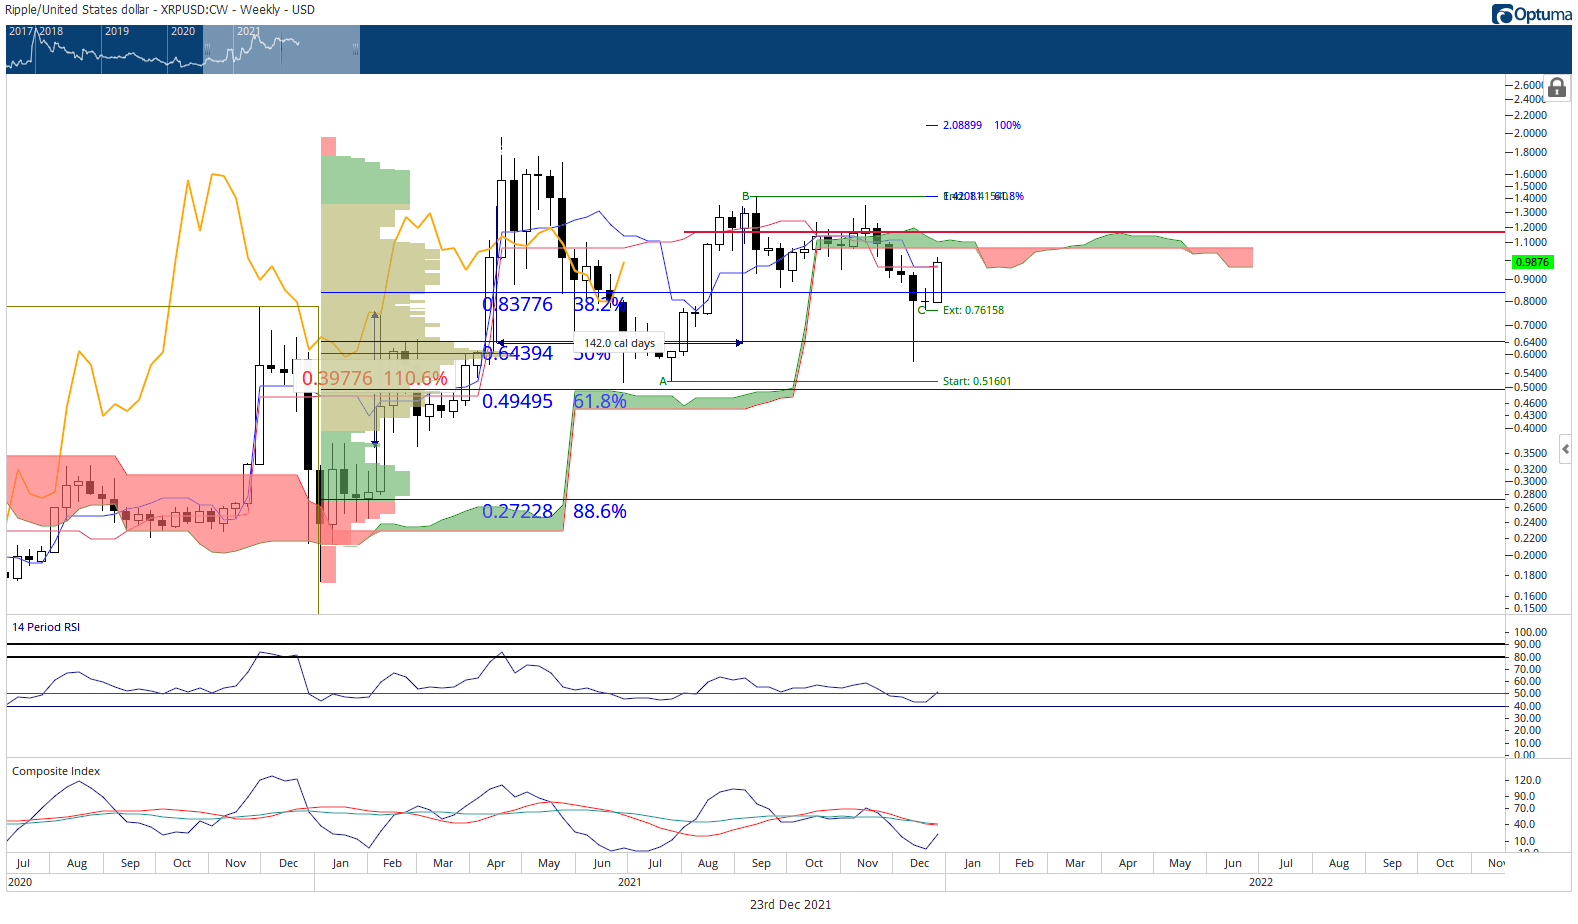
However, as long as XRP price remains below the Cloud, it is still considered bearish. This bullish outlook would be invalid if a close below the $0.80 value area occurred. XRP price would probably flash-crash towards the $0.50 level in that scenario.
Author

Jonathan Morgan
Independent Analyst
Jonathan has been working as an Independent future, forex, and cryptocurrency trader and analyst for 8 years. He also has been writing for the past 5 years.



