Top 3 Price Prediction Bitcoin, Ethereum, Ripple: What to consider for the remainder of Q4
- Bitcoin shows a divergence between summer lows and the newly established low at $15,632.
- Ethereum price surged by 20% after the free-fall decline earlier in the week.
- XRP price could be confined to a wide range for the remainder of the year.

The crypto market gives investors and traders a chance to speculate on the next directional move. As the clock winds down towards a highly anticipated/nostalgic Q4 Christmas rally, the top 3 cryptos show subtle signals of optimism. Key levels have been defined to forecast possible outcomes for the Crypto giants in the coming weeks.
Bitcoin price shows hopeful cues
Bitcoin price is once again in a make-or-break situation. After a 25% decline, the peer-to-peer digital currency recovered 16% of its market value. As a profit-taking consolidation unfolds near $17,000, investors are forced to ask a central question. Is the current BTC price a discount before a stronger countertrend rally or an alluring trap before the downtrend continues?
Bitcoin price currently trades at $16,718. The 25% decline printed a new yearly low at $15,632. The Relative Strength Index (RSI)shows a bullish divergence between the newly established low and the June 18 lows that held as support throughout the summer. The Volume Profile indicator shows investors are much more interested in the market now than they have been throughout the summer.
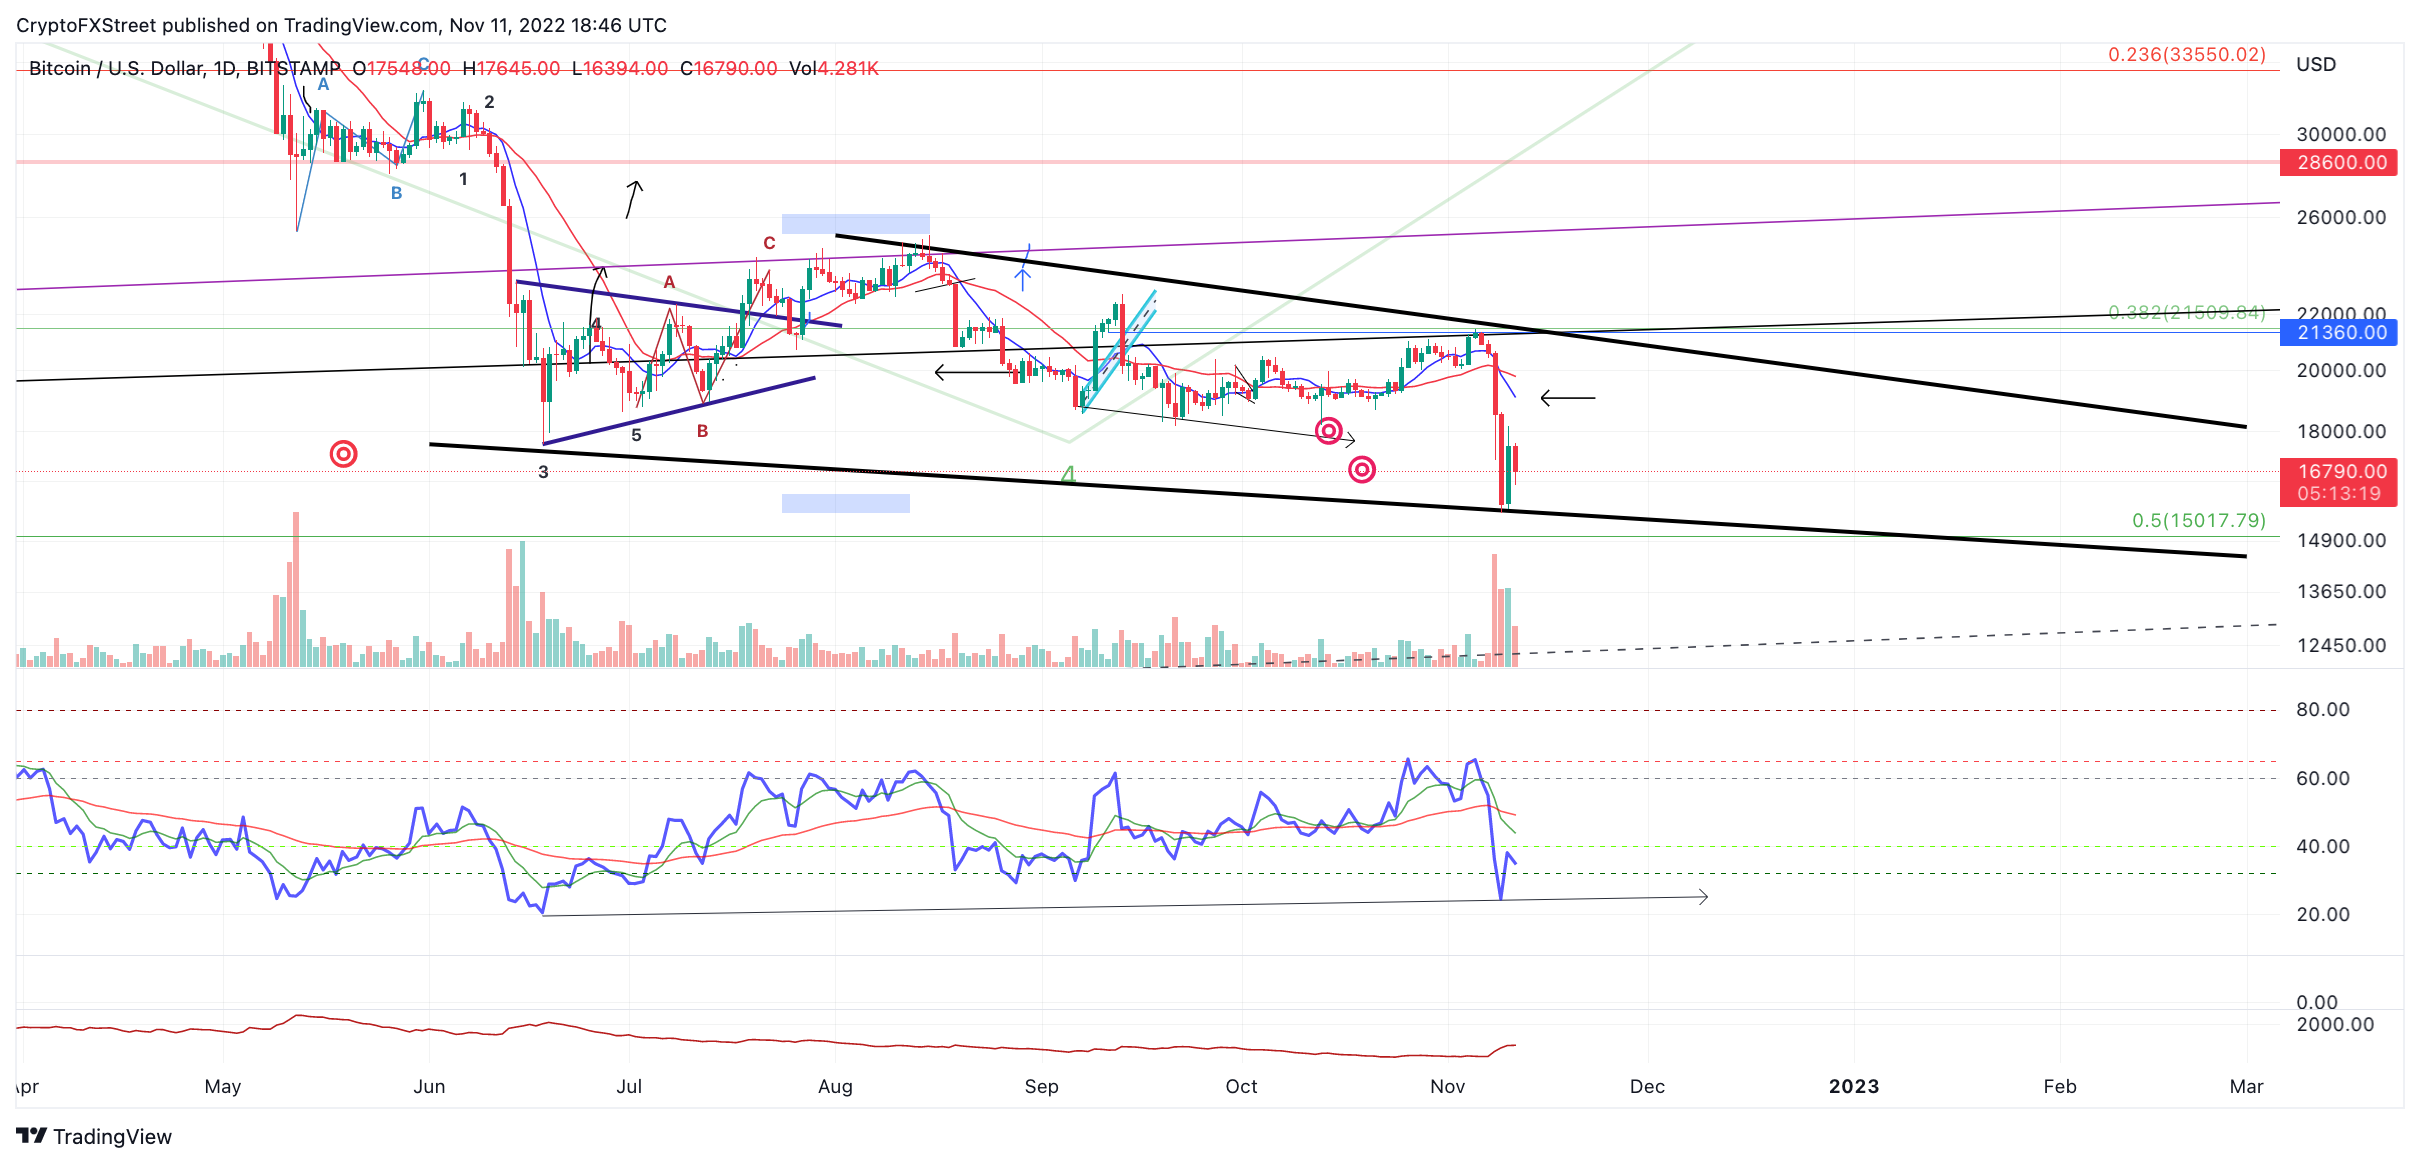
BTCUSDT 1-Day Chart
Considering the RSI divergence and uptick in volume, Bitcoin will likely witness an influx in volatility. If the divergence continues, the Bitcoin price could challenge the newly established bears near $20,000. A second target could be summer liquidity levels near $23,400.
Still, calling a market bottom, whether interim, weekly or on longer time frames, is always the most dangerous trade. Traders should consider applying healthy risk management techniques to minimize losses while trying to catch the knife.
Invalidation of the bullish idea is a breach below $15,900. If the level is tagged, the new lows will likely get breached, and a further decline toward 2020 liquidity levels in the $14,000 zone will probably be Bitcoin's next landing ground. The bearish scenario would result in a 15% dip from the current market value.
In the following video, our analysts deep dive into the price action of Bitcoin, analyzing key levels of interest in the market. -FXStreet Team
Ethereum price fights back
Ethereum price has witnessed a 25% relief following the positive US CPI announcement during the second week of November. Before the move, ETH saw a penny-from-Eiffel-style decline, bringing prices to sub-$1100. Although Bitcoin shows optimistic signals, Ethereum has subtle cues suggesting bullish countertrend traders should apply more cautionary measures.
Ethereum price auctions at $1,276 as the market consolidates just below the recently broken support zone established between September and October. The bulls produced a daily closing candle back into the broken support zone, which is a positive note. A Fibonacci retracement tool surrounding the strong part of this week's decline suggests the bulls have already rallied 50%. Therefore the ETH price could be capped at exceeding higher gains. The next target would be the 61.8% level at $1,362. Traders should expect a profit-taking reaction at the Fib level if ETH and the level are reacquainted.
Still, a 2.5-1 reward-to-risk ratio can be achieved by aiming for the 61.8% Fib level. The trade idea would require the current consolidation to endure bearish pressure without breaching the daily low at $1,201. If the invalidation level is breached, a retest of the recent lows could occur near $1,080. Such a move would result in a 15% decline from the current Ethereum price.
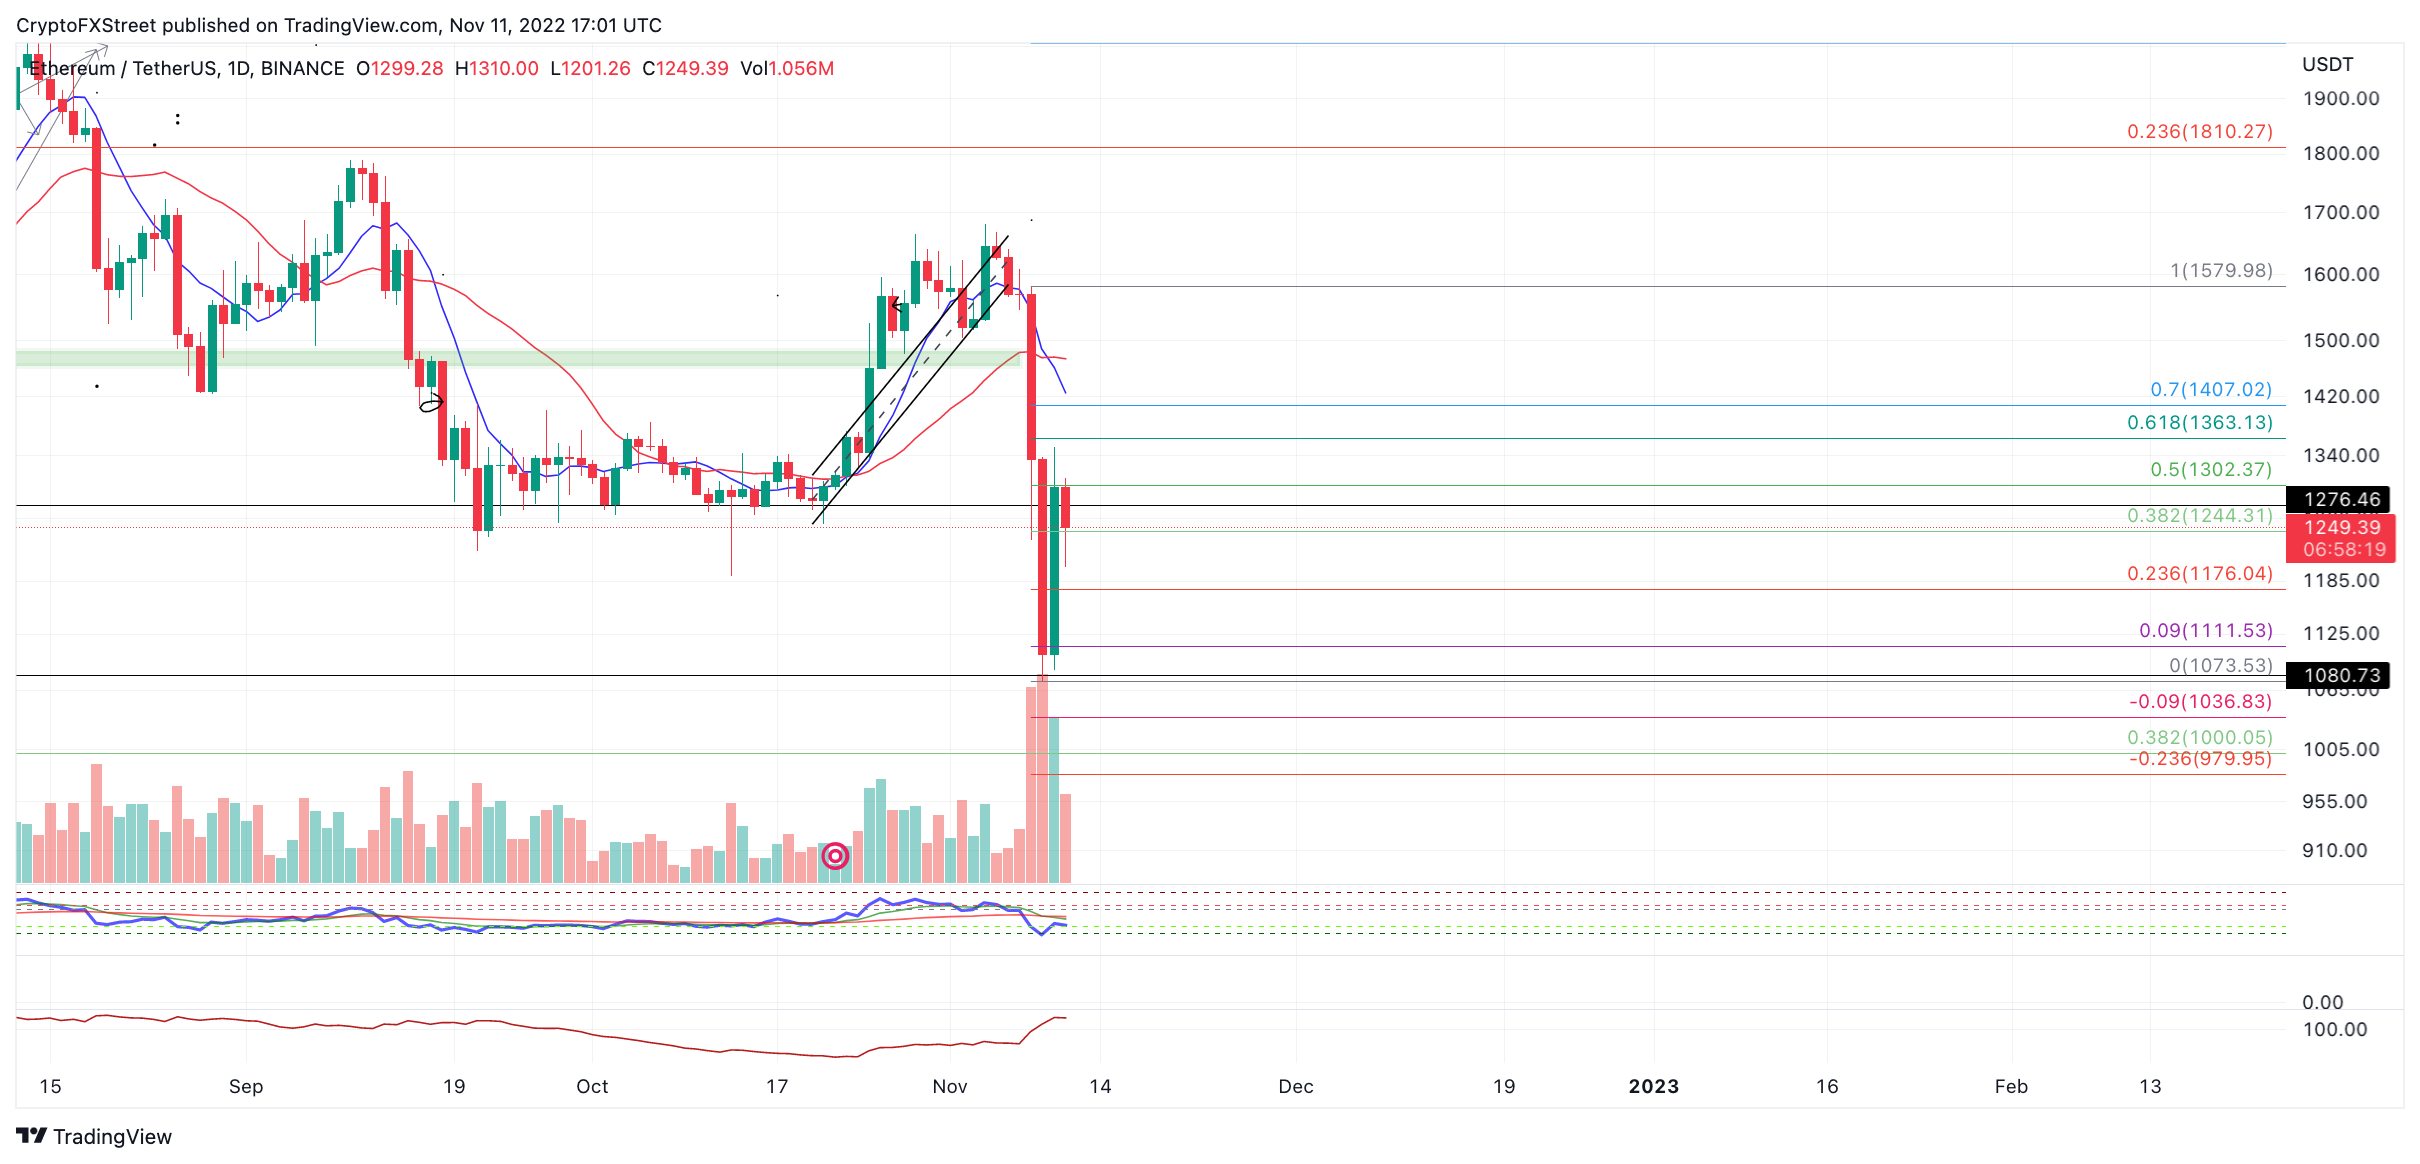
ETHUSDT 1-Day Chart
In the following video, our analysts dive deep into the price action of Ethereum, analyzing key market interest levels. -FXStreet Team
XRP price could be range-bound
XRP price currently auctions at $0.38. On November 10, the bulls achieved an 18% recovery rally. The rally established a large bullish engulfing up-bar a few integers short of the $0.40 price level on the daily time frame. The Relative Strength Index (RSI) shows the November 9 low at $0.3160 as more oversold than the June 13 bottom at $0.3012. This subtle information suggests XRP has underlying strength and could be the catalyst to challenge newly established bears in the market.
XRP price could fluctuate between $0.32 and $0.56 for the remainder of potentially Q4. Liquidity levels as high as $0.66 could face a challenge if the bulls can reconquer the $0.50 zone, but traders should take things one step at a time. If the market has bullish potential, the divergent June 13 low at $0.30 will need to remain unbreached. If the invalidation level is tagged, an additional decline toward 2020 liquidity levels near $0.26 could occur. Such a move would result in a 35% decline from XRP's current market value.
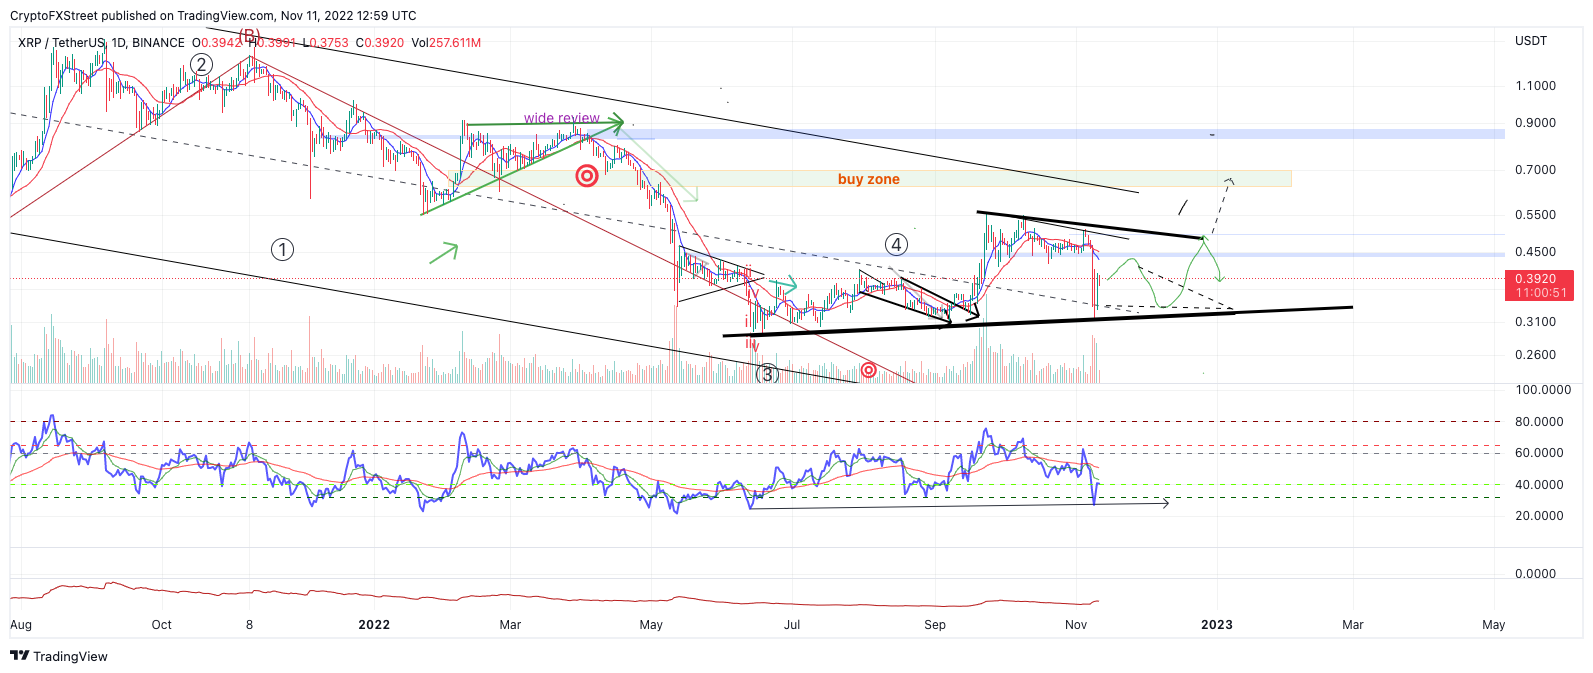
XRPUSDT 1-day chart
In the following video, our analysts deep dive into the price action of Ripple, analyzing key levels of interest in the market. -FXStreet Team
Author

Tony M.
FXStreet Contributor
Tony Montpeirous began investing in cryptocurrencies in 2017. His trading style incorporates Elliot Wave, Auction Market Theory, Fibonacci and price action as the cornerstone of his technical analysis.


