XRP Price Prediction: Ripple could do what it always does, sideways trading, then explode
- Ripple price fell by 35% in November and recovered half of the losses within 24 hours during the initial US CPI-induced relief rally.
- XRP shows RSI divergence between lows since June 13, hinting that price may be confined to trading within a wide range.
- Invalidation of the bullish scenario is a breach below $0.2936.

XRP price has produced higher lows after every liquidation since June 13. This subtle evidence suggests XRP could be confined to a wide range for weeks. Key levels have been identified to help traders identify profitable scenarios.
XRP will be a challenge
XRP's recent rejection from the $0.50 barrier went far lower than expected. As a sideways triangle formed near $0.50, the technicals showed promising breakout potential. Unfortunately, the optimism was swept away during the second trading week of November as the digital remittance token fell by 35% and invalidated the bullish symmetrical triangle that investors were hoping for.
XRP price currently auctions at $0.38. On November 10, the bulls pulled off an 18% recovery rally, establishing a large bullish engulfing up-bar a few integers short of the $0.40 price level. The Relative Strength Index (RSI) shows the November 9 low at $0.3160 as more oversold than the June 13 bottom at $0.3012. This subtle piece of information suggests XRP has underlying strength and could be the catalyst to challenge recently established shorts in the market.
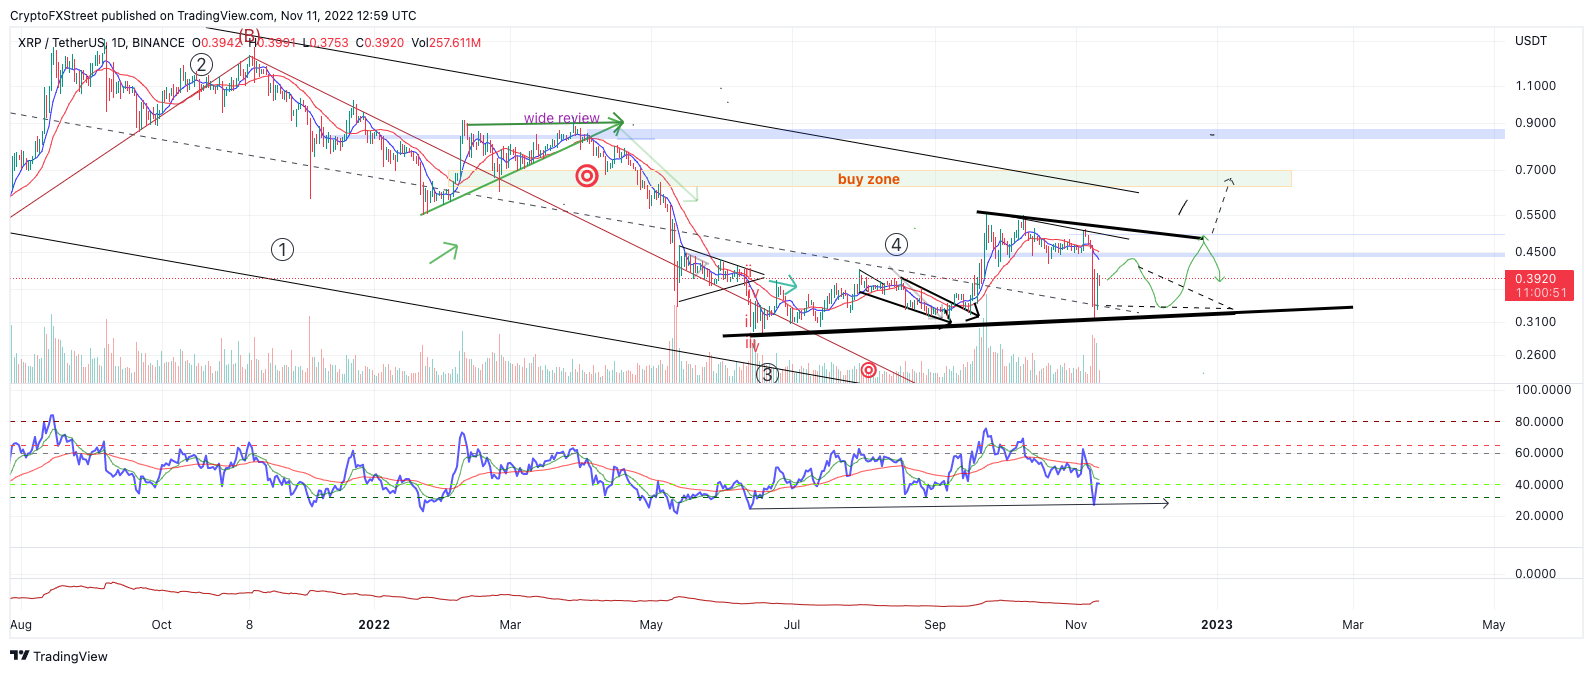
XRPUSDT 1-day chart
XRP price could trade between $0.32 and $0.56 in the coming weeks. Now that the triangle thesis, which projected a rally to the $0.60 zone, is invalid, expecting the unexpected could lead to rewarding gains for patient, healthy risk-taking investors. Liquidity levels as high as $0.66 could face a challenge if the bulls can reconquer the $0.50 zone, but traders should take things one step at a time.
If the market has bullish potential, the June 13 low at $0.30 will need to remain intact. A further decline toward 2020 liquidity levels near $0.26 could occur if the lows are breached. Such a move would result in a 35% decline from the current XRP price.
In the following video, our analysts deep dive into the price action of Ripple, analyzing key levels of interest in the market. -FXStreet Team
Author

Tony M.
FXStreet Contributor
Tony Montpeirous began investing in cryptocurrencies in 2017. His trading style incorporates Elliot Wave, Auction Market Theory, Fibonacci and price action as the cornerstone of his technical analysis.


