Top 3 Price Prediction Bitcoin, Ethereum, Ripple: Mayhem ahead of US election as cryptocurrency market bleeds
- Bitcoin downtrend stretched towards $13,000 amid widespread losses in the market.
- Ethereum revisited the crucial support at $370 after losing the anchor at the 200 SMA.
- Ripple has bounced off the support provided by the x-axis of a descending triangle.

The cryptocurrency market succumbed to another unexpected selloff on Tuesday during the Asian session. These losses that saw major cryptocurrencies like Bitcoin, Ethereum and Ripple drop sharply are likely triggered by regulation news from Hong Kong. The Securities and Futures Commission (SFC) said it would require all cryptocurrency trading platforms to be regulated.
The selloff extended to other crypto assets, wiping off approximately $17 billion from the total market capitalization. Currently, the entire market value stands at $384 billion, down from $404 billion, as recorded by CoinMarketCap on Tuesday. An increase in the 24-hour trading volume from $64 billion to $86 billion highlights the selling pressure's magnitude. US presidential elections are looming, bringing more caution and risk aversion to the cryptocurrency market.
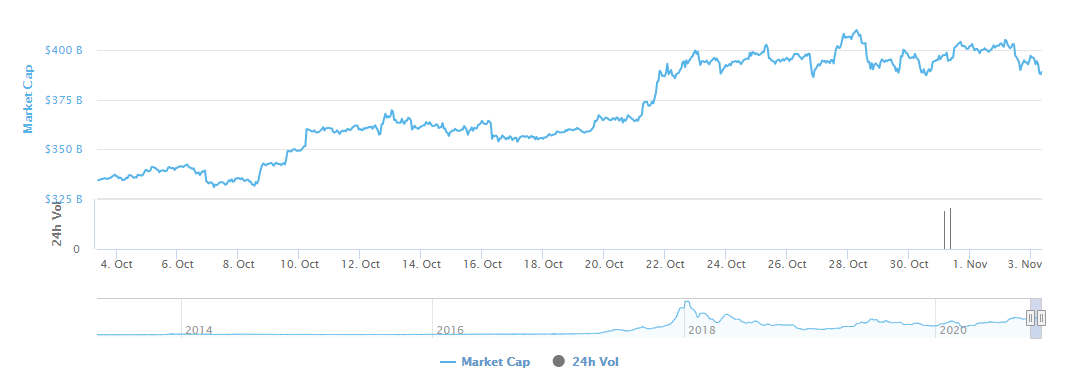
Crypto market capitalization chart
Bitcoin bears regain control
The flagship cryptocurrency recently made a gigantic spike past $14,000, when it reached a new yearly high of $14,100. However, a reversal quickly occurred, which sent the king of crypto assets under the same $14,000 level. Instability due to news regarding the regulation of exchanges in Hong Kong extended the lower leg below $13,500. BTC/USD also crossed beneath the 50 Simple Moving Average in the 4-hour range, opening the road to losses eyeing $13,000.
The ongoing declines are likely to retest $13,000, especially if the short-term buyer congestion zone at $13,200 breaks down. Glancing lower, the 100 SMA is in line to provide anchorage under $13,000, while the 200 SMA will cushion BTC from plunging to levels below $12,000. According to the Relative Strength Index (RSI), the path of least resistance is downwards, at least for now.
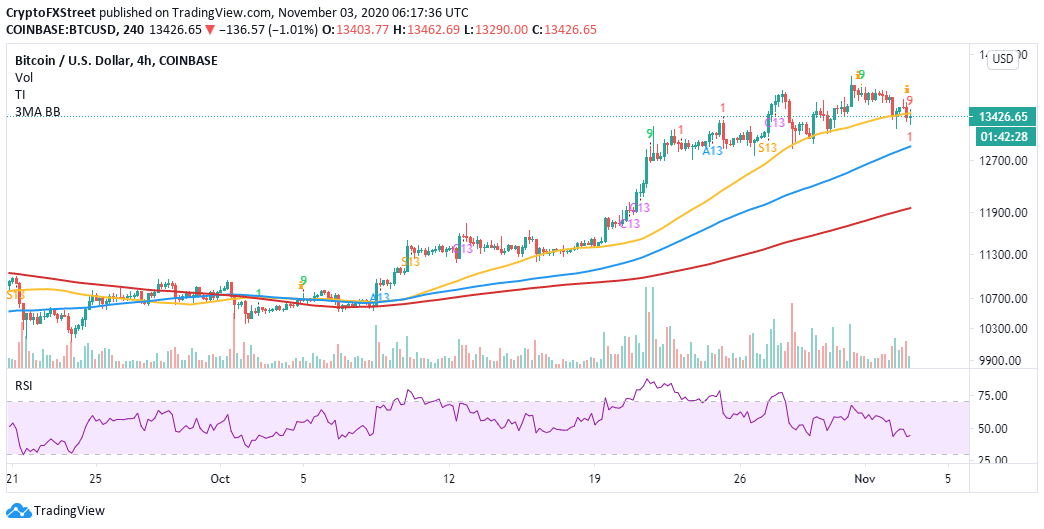
BTC/USD 4-hour chart
On the flip side, the bearish outlook will be invalidated if Bitcoin closes the day above the 50 SMA. Such a price action will encourage investors to hold still and stop panic selling. An increase in buy orders might create enough volume to support gains beyond $13,500. Besides, the TD Sequential indicator recently presented a buy signal in the form of a red nine candlestick on the 4-hour chart.
Ethereum holds firmly to the critical support at $370
Ethereum's correction from $400 sent the price back into a descending parallel channel formed on the 4-hour chart. The losses also stretched below $380 and the 200 SMA. On the bright side, the buyer congestion at $370 remained intact.
According to the Moving Average Convergence Divergence (MACD), the path with the least hurdles is still downwards. Moreover, the broken support at the 200 SMA is now hindering the price movement. If Ethereum slipped below $370, losses to $360 would become apparent and bring the picture the lower support area of $340.
 - 2020-11-03T093025.945-637399851559450469.png)
ETH/USD 4-hour chart
The expected downtrend would be thrown out of the picture if Ethereum closed the day above the 200 SMA. Additional price action past $380 might call for more buy orders, hence creating enough volume for a reversal to $400. However, buyers must be aware of potential delays in the recovery due to the resistance highlighted by the 50 SMA. Another hurdle to keep in mind is 100 SMA above $390.
Ripple extends the breakdown to $0.23
Ripple traded underneath a descending trendline since the rejection suffered marginally above $0.26. Several tentative support levels, including $0.25 and $0.24, tried but failed to stop the losses. The broad-based declines in the market on Tuesday refreshed support at $0.23.
The RSI shows signs of recovery after hitting oversold levels. XRP price action above $0.23 is expected to kick start a rally. The reversal's magnitude will depend on whether enough volume will be created from the current price level. On the upside, resistance is expected at $0.24, the 50 SMA and the confluence formed by the 100 SMA and 200 SMA.
-637399852191552454.png)
XRP/USD 4-hour chart
On the downside, the descending triangle's support must hold to reinforce the buyer congestion area at $0.26. Traders should have it in mind that action under the x-axis might bring panic to the market, resulting in more selling pressure and more significant losses under $0.20.
Author

John Isige
FXStreet
John Isige is a seasoned cryptocurrency journalist and markets analyst committed to delivering high-quality, actionable insights tailored to traders, investors, and crypto enthusiasts. He enjoys deep dives into emerging Web3 tren


