Ripple Price Analysis: XRP whales accumulate heavily as technicals scream buy
- Ripple whales have been on an accumulating spree since mid-October.
- XRP’s daily chart shows that it is on the verge of flashing the buy signal via the red-nine candlestick.

Ripple rose from $0.24 on October 12 to $0.26 on October 23. Since then, the price has been on a massive downtrend, having dropped to $0.235 at the time of writing. However, technical analysis reveals that the buyers are going to come roaring back soon.
Buyers looking to do a comeback
XRP/USD daily chart has started flashing the TD sequential indicator's buy signal with a red-nine candlestick. If this outlook is validated, the cross-border remittance token should be able to break past the 50-day SMA ($0.245). After breaking past this barrier, the next strong resistance zone lies at the 100-day SMA ($0.26). If the bulls stay strong, Ripple may break above this and reach $0.3.
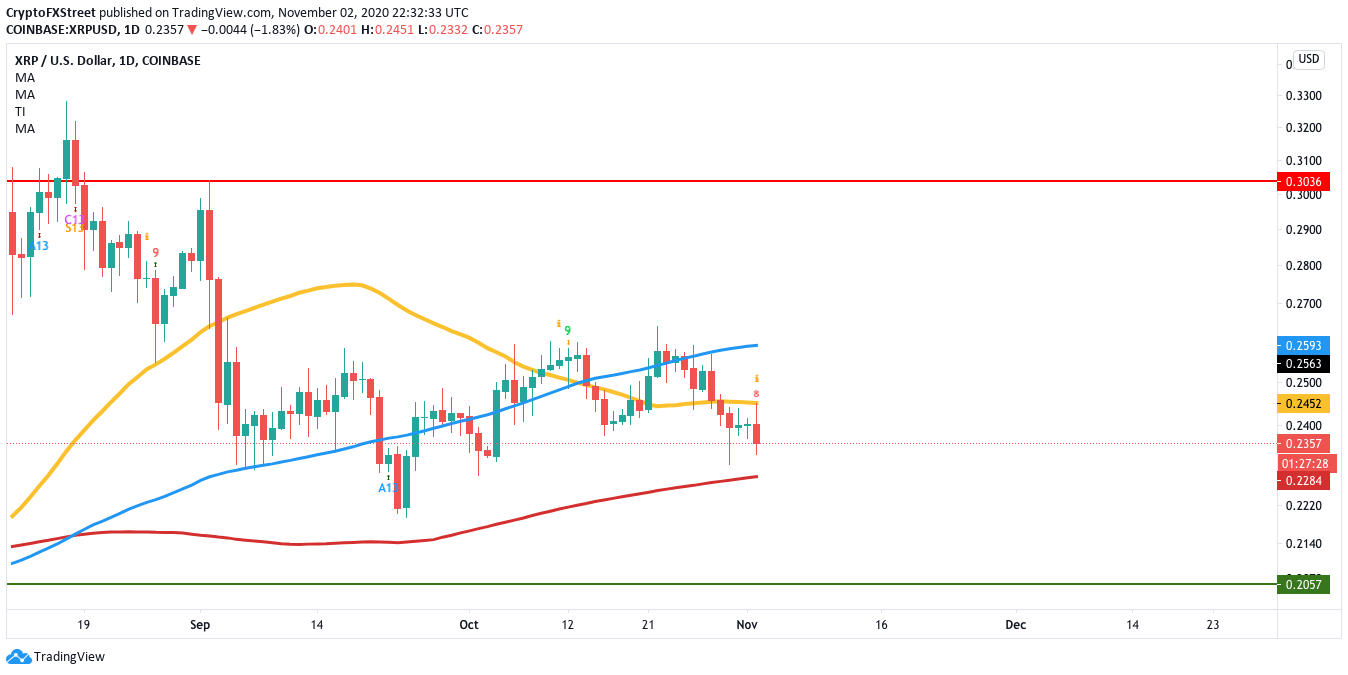
XRP/USD daily chart
Adding further credence to the bullish outlook is the way the holders have been behaving since mid-October. Santiment’s holders distribution chart shows us that the number of addresses holding 1 million to 10 million tokens has been increasing steadily. There was a significant dip on 27-29 October, before it shot up from 1,336 to 1,342 at the time of writing.
 [04.18.56, 03 Nov, 2020]-637399561759458634.png)
Ripple holders distribution
Can the bears take back control?
The bears can invalidate the buy signal and take the price down to the 200-day SMA ($0.228). The 200-day SMA has historically acted as a strong resistance level, so it should be able to absorb a large amount of selling pressure. Any further break will take XRP down to the $0.2057 support wall.
Key price levels to watch
XRP bulls have to overcome the 50-day SMA ($0.245) and the 100-day SMA ($0.26). If they manage to do that, the price should be able to reach $0.30.
On the downside, the bear has a healthy support wall at the 200-day SMA ($0.228). A further break will take the price down to the $0.2057 line.
Author

Rajarshi Mitra
Independent Analyst
Rajarshi entered the blockchain space in 2016. He is a blockchain researcher who has worked for Blockgeeks and has done research work for several ICOs. He gets regularly invited to give talks on the blockchain technology and cryptocurrencies.


