Top 3 Price Prediction Bitcoin, Ethereum, Ripple: ETH outperforming its peers, BTC struggles and XRP bearish
- Bitcoin refrains from making new highs as Tuesday’s gap-fill kills uptrend continuation.
- Ethereum outpaces its peers by barely hitting new all-time highs.
- XRP price again looking for direction as investors interest wanes.

The Bitcoin bull rally got stopped in its tracks this week after BTC price came under more pressure from the Omicron story, and the resulting market turmoil. Ethereum price, however, came just $16 away from making a new record high, making gains in contrast to the other two majors. XRP saw investors buying the dip, but the uptrend hit a wall and got stopped in its tracks.
Bitcoin price on the backfoot after a slowdown that made it lose bullish momentum
Bitcoin (BTC) price popped higher at the beginning of the week, shrugging off investors' concerns about the new Covid variant.On Monday, BTC price opened up much higher than where it closed on Sunday, forming a gap in the chart. As a general rule, gaps get filled sooner rather than later, and this was the case on Monday, when bulls saw their early gains lost as BTC price retraced to fill the gap.
Bears have seized the opportunity to defend the new monthly pivot for December at $59,586, which coincides with the start of a Fibonacci retracement.. Evidence of this weakening can be found in the Relative Strength Index (RSI), dipping back below 50, showing that bullish demand is starting to wane.
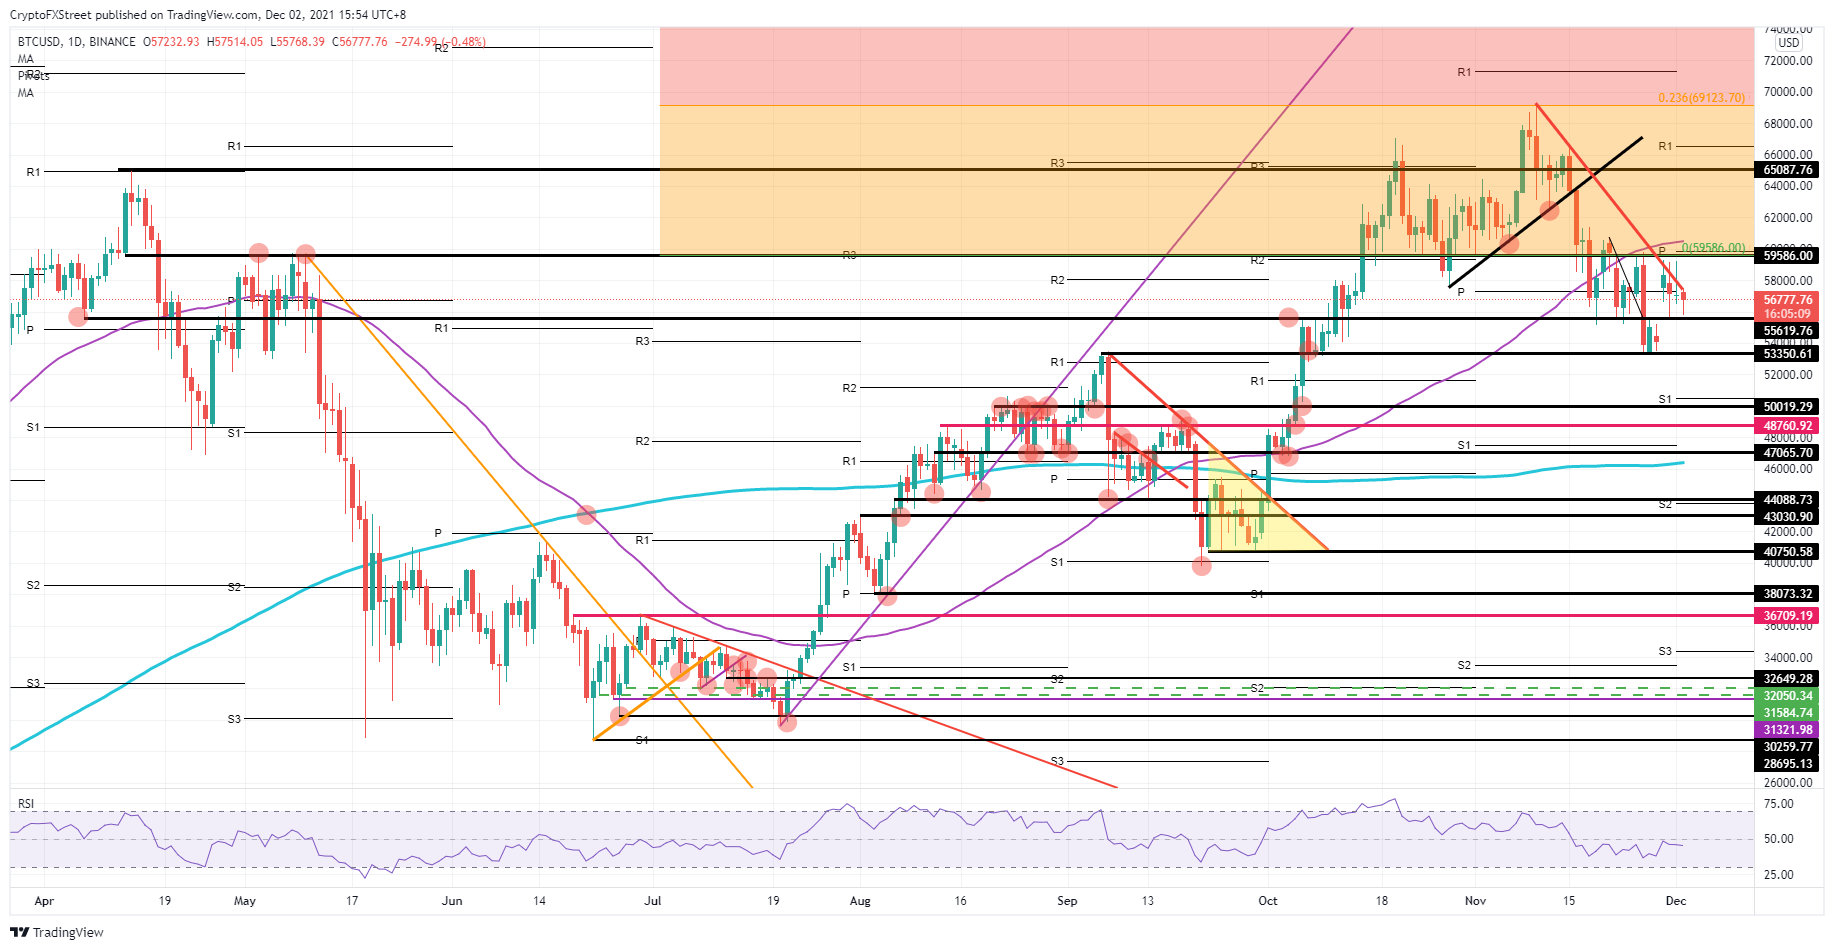
BTC/USD daily chart
As a result of current market uncertainty, expect potential investors to stay on the sidelines. Although the red descending trend line has been broken a little, it still holds importance and investors will probably only step in following a break back above it, helped, perhaps, by breaking news about vaccine effectiveness against the new strain. Either that or investors will sit on their hands and wait for another bounce off $53.350. Should that level fail to hold, however, and there is more bad news,, expect a quick 6% drop towards the $50,000 psychological level and previous historical support. At that level bulls will likely mount a defence against a further downturn.
Ethereum price outpaces its peers and could make new highs by the end of this week
Ethereum (ETH) price, unlike Bitcoin and XRP, saw bulls run a tight and steep rally from $4,000 towards $4,936 in just five days. That was in a troubled market facing considerable headwinds. That said, bulls now need to keep a tight stop on current ETH price action in order for a bull trap not to form, after the pull-back on profit-taking that occurred in the wake of price barely hitting an all-time high.
ETH quickly reversed from its highs on Wednesday and tested the December pivot at $4,481. That is just $16 above the historical technical level marked up on the chart from November 12. This is a level of great importance and it will be very interesting to see if bulls can maintain price action above it, perhaps, helped by a possible bounce off the red top line that has so far been successfully capping price action to the upside.
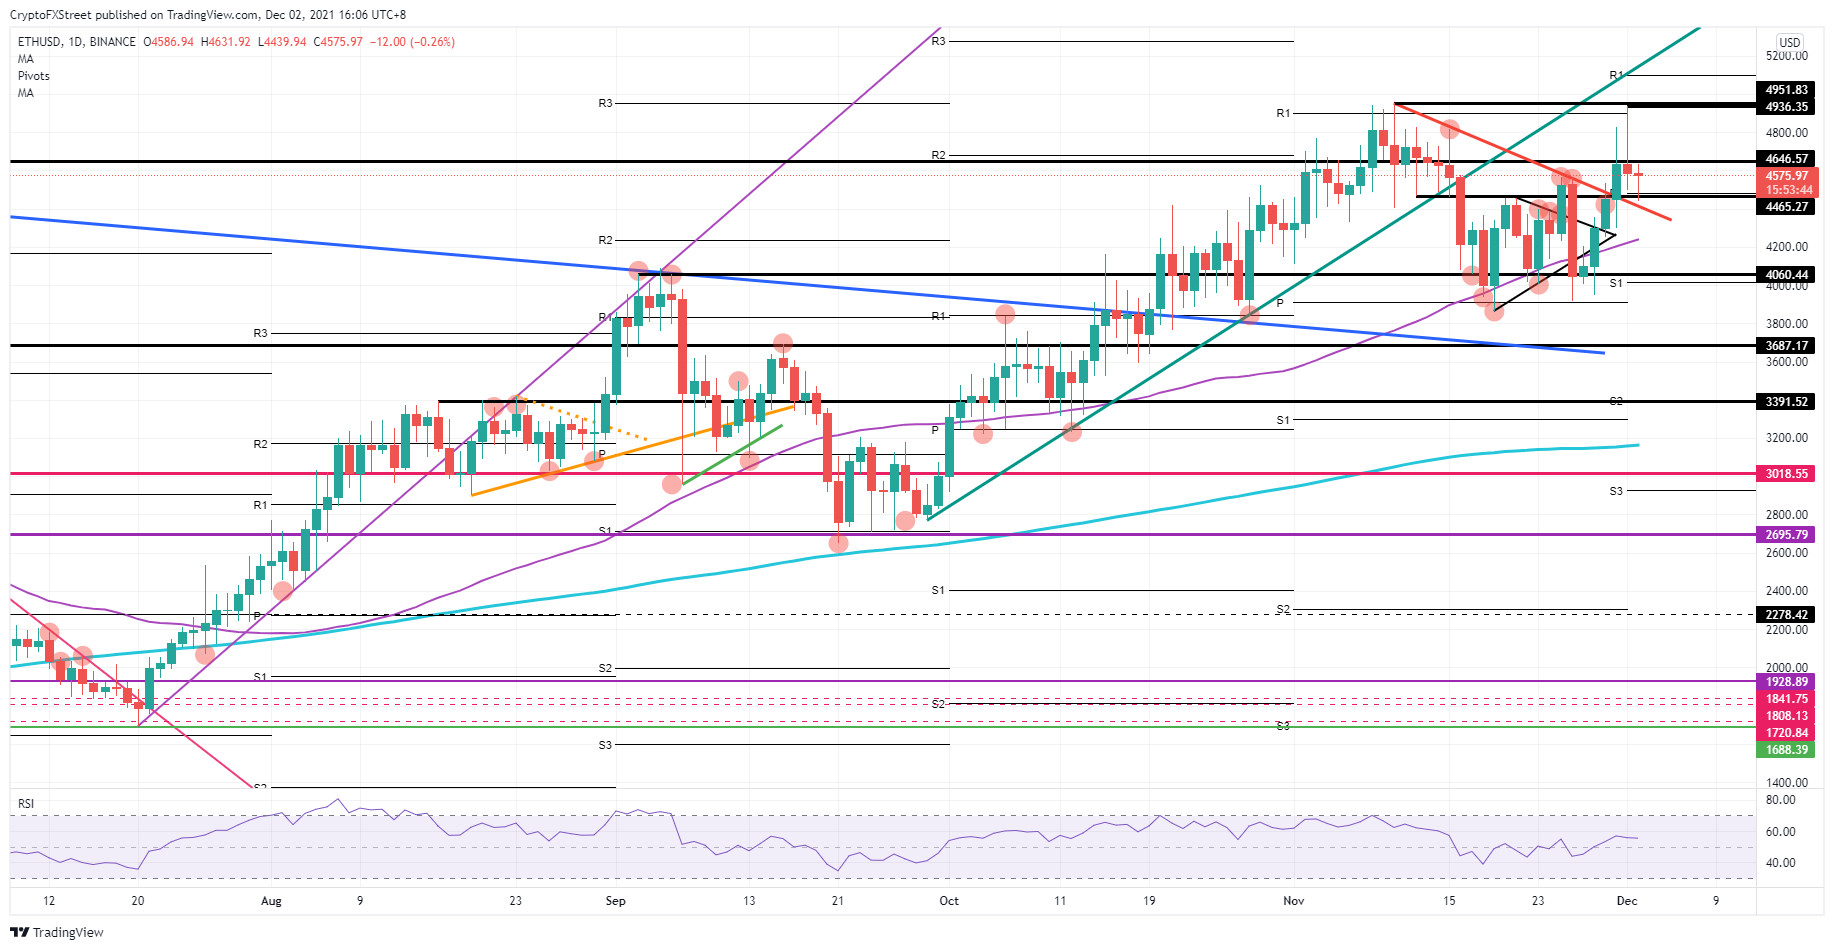
ETH/USD daily chart
That red descending trend line, on the other hand, should support a break below $4,465, but if bulls flee the scene, expect a bull trap to form and price to run down lower. The first support tested in that decline is the historical double top at $4,060, with the monthly S1 support level at $4,000 just below there. The correction could already hold 18% of accrued losses from the highs of Wednesday, which would attract investors interested in the buying opportunity at those levels.
XRP price sees bulls rejected at $1.05, pushing price back towards $0.88
Ripple (XRP) price saw sparks fly in a nice uptrend on Wednesday, but then hit a bump in the road after the $1.05 level held firmly, following two failed tests to the upside. The rejection that squeezed prices to the downside on Tuesday, probably washed out quite a lot of investors and technical traders, and caused the lack of momentum and drive in XRP price action to tackle that $1.05 resistance. As the price fades further to the downside today, expect current market uncertainty to weigh further on XRP and see a possible retest of the short-term double bottom at $0.88.
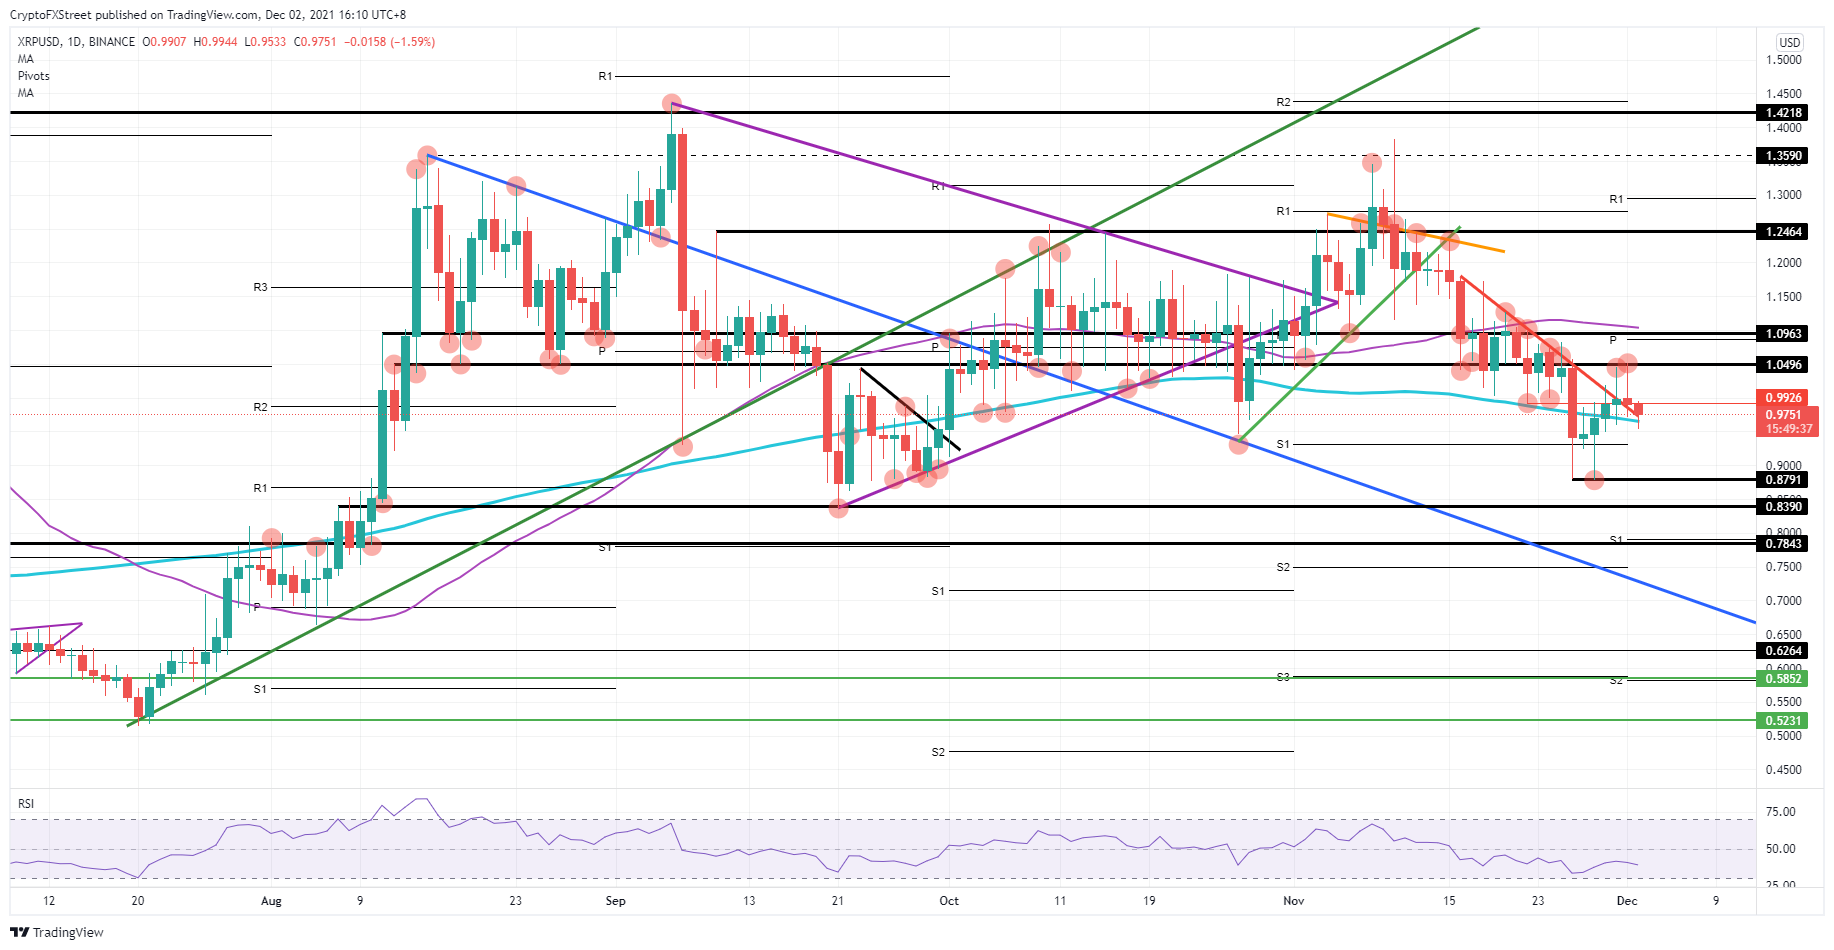
XRP/USD daily chart
On a retest of that double bottom, a break looks more than likely, as the level holds no historical or other significance. That would hand bears the opportunity to push XRP price down towards either $0.84, for the third test of support at that level, or breakthrough and run down to $0.80, which is a prominent figure and the level of the monthly S1 pivot support level, combined with a historical significant support level at $0.78, originating from June 8. This would provide the perfect zone for a fade-in trade for XRP traders.
Author

Filip Lagaart
FXStreet
Filip Lagaart is a former sales/trader with over 15 years of financial markets expertise under its belt.


