Top 3 Price Prediction Bitcoin, Ethereum, Ripple: Crypto markets bleed as bulls prepare for final comeback
- Bitcoin price has dipped below the $30,000 level, creating panic among many investors.
- Ethereum price has come extremely close to testing the range low, hinting at a reversal.
- Ripple price shows signs of recovery, suggesting that it is taking point.

Bitcoin price has been on a steady downtrend since June 15, with an intermediate pump that peaked on June 29. As the descent progresses, BTC approaches a crucial support level that could be swept before kick-starting an upswing.
Ethereum and Ripple have both followed the big crypto’s lead, but XRP price seems to have already triggered its upswing.
Bitcoin price shows signs of recovery
Bitcoin price shows weakness as the bears are overwhelming the buying pressure, leading to a 19% downswing over the past three weeks. This sell-off has pushed BTC to retest or slice through the $30,000 psychological level for the fourth time in the past two months.
Although Bitcoin price has closed below the said barrier on a lower time frame, the daily chart shows hope, primarily due to the set up of a premature cycle bottom in the form of a yellow up arrow on the daily candlestick formed by the Momentum Reversal Indicator (MRI).
This setup indicates that the following daily candlestick will flash a buy signal that forecasts a one-to-four candlestick upswing if the crash continues.
This move might push BTC up by 18% to tag the 50% Fibonacci retracement level at $35,618.
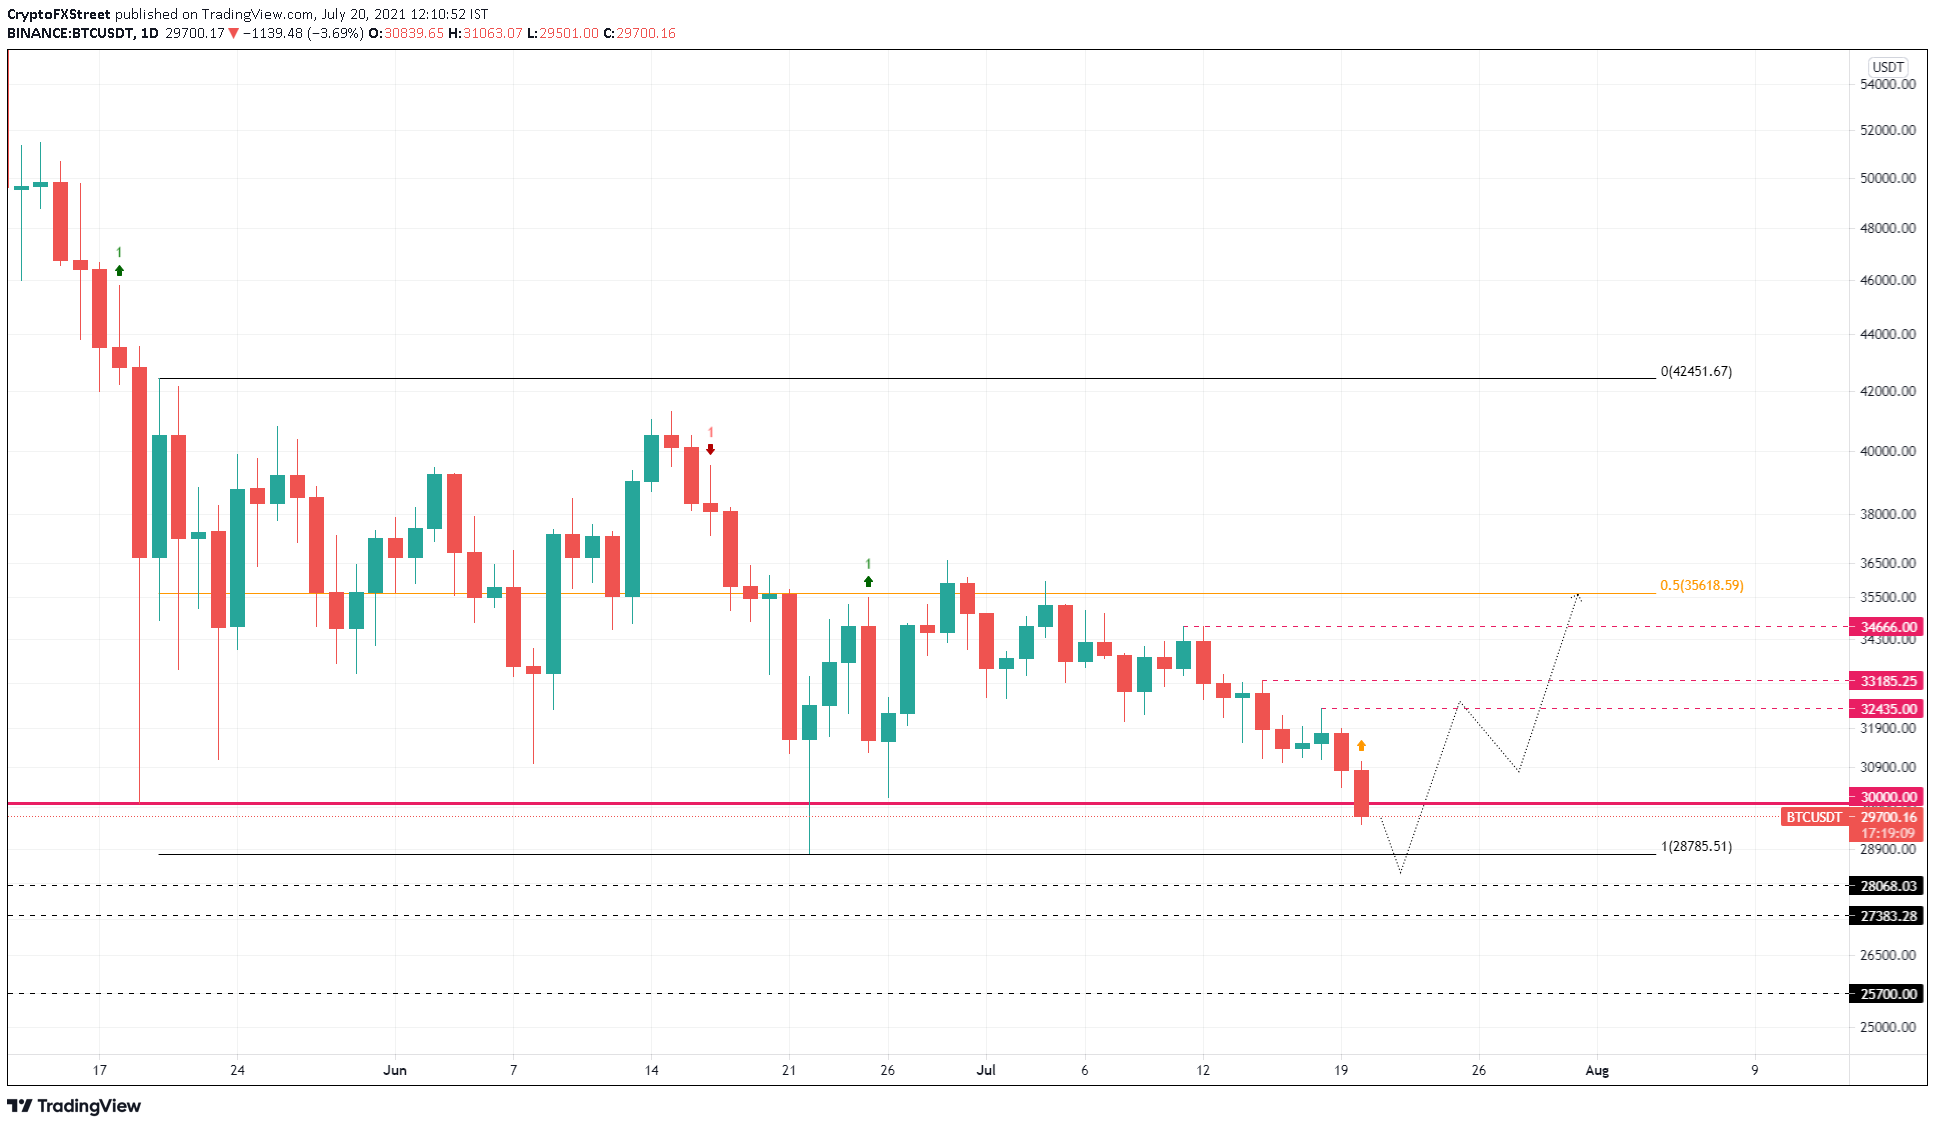
BTC/USDT 1-day chart
On the flip side, if the downswing invalidates the MRI’s buy signal, it will indicate that the bears are in control and that a further sell-off is likely.
The first target that sellers would push Bitcoin price is $28,068, breaching this demand floor would push the big cryptocurrency down to $27,383. If this barrier is breached, it will invalidate the bullish thesis and drag the pioneer cryptocurrency to $25,700.
Ethereum price approaches point of reversal
Ethereum price missed testing the range low at $1,706 by $6. Regardless, the current 6-hour candlestick is already hinting at signs of a reversal. If the buying pressure continues to rise, ETH is likely to encounter the first significant resistance barrier at $2,018.
A decisive close above this ceiling will mean a higher high, indicating the start of a new uptrend and that buyers are ready to push the smart contract token to new levels.
If ETH sustains above this level and the bullish momentum continues to back it, there is a high chance that Ethereum price will rally 13% to retest the 50% Fibonacci retracement level at $2,297.
While a move above this barrier is possible, it is unlikely due to the consolidation phase that isplaguing the cryptocurrency market.
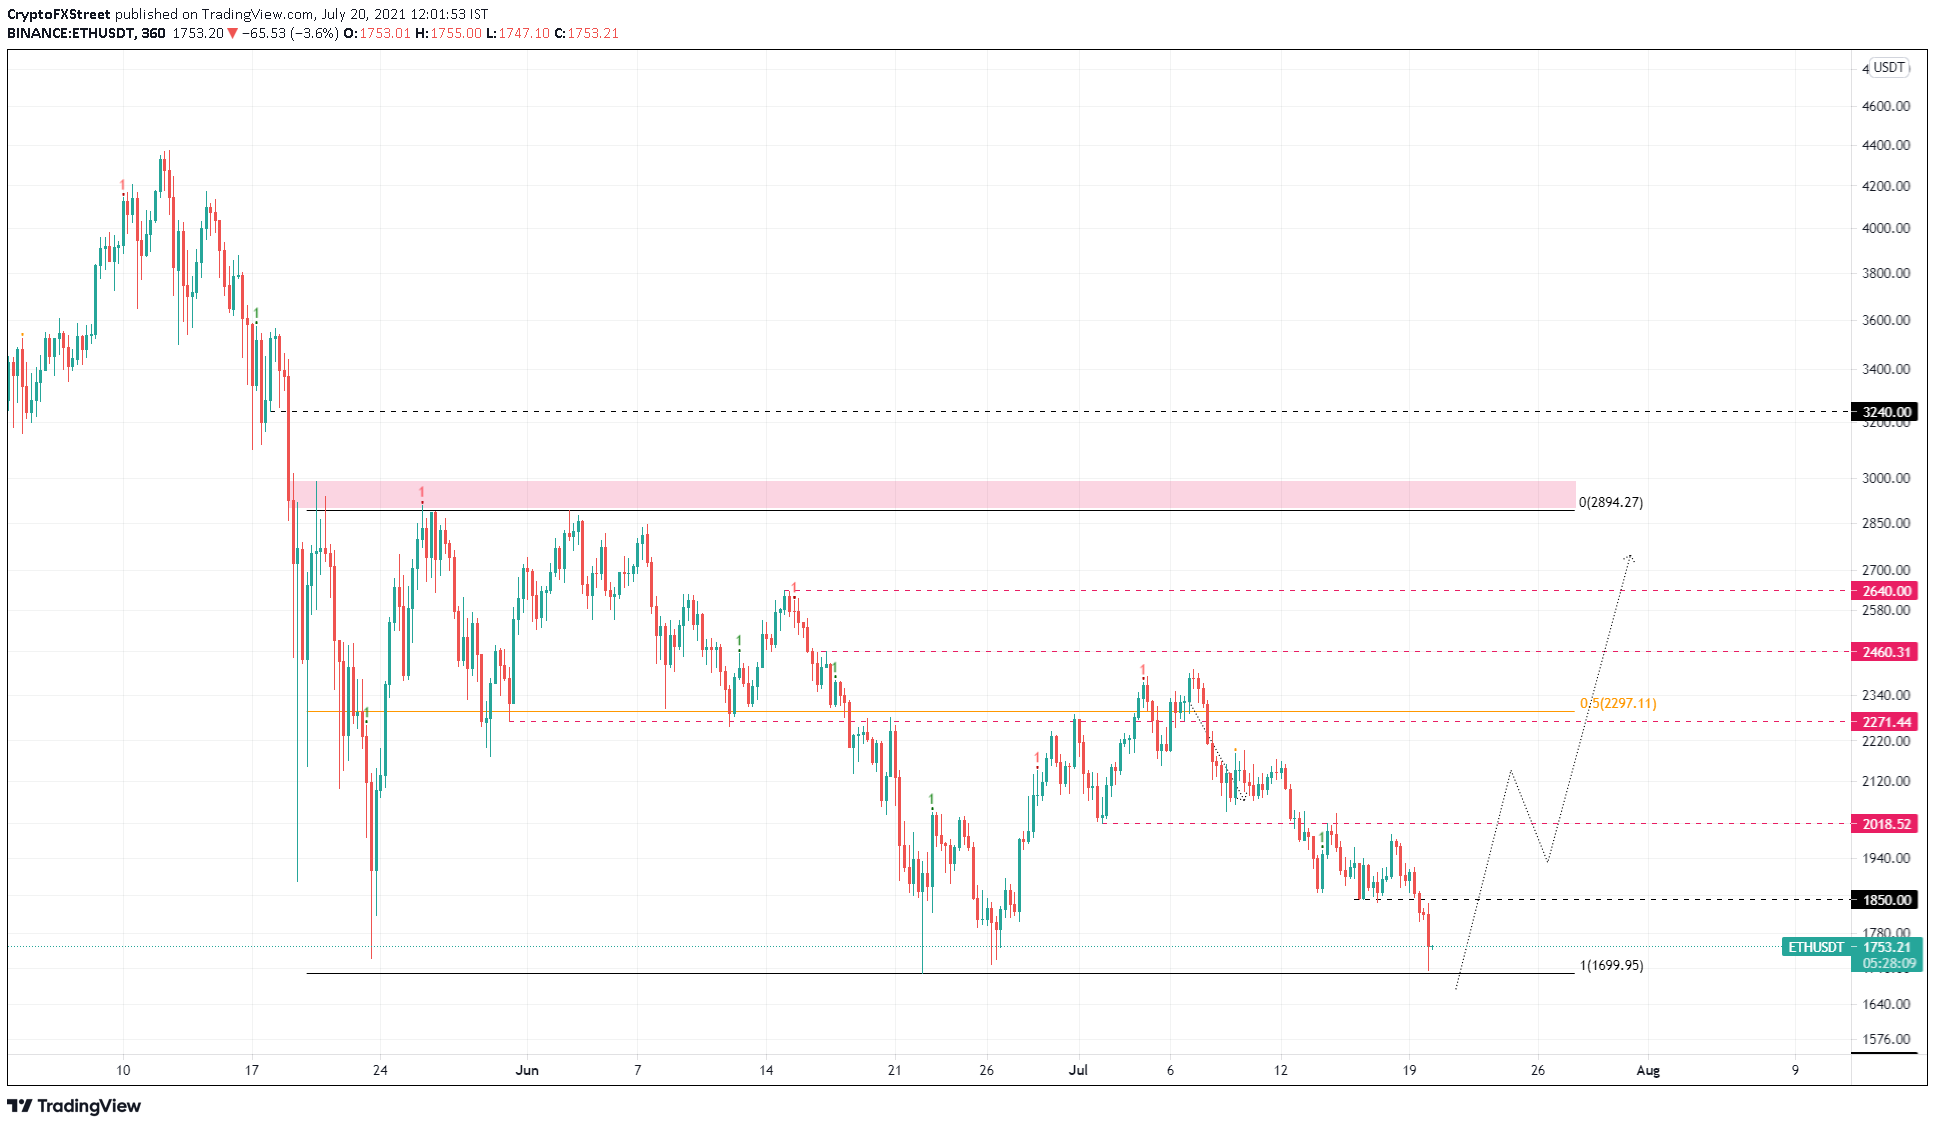
ETH/USDT 6-hour chart
Regardless of the optimism, if the sellers push Ethereum price to shatter the range low at $1,700, it will indicate the inability of the buyers to defend.
A swift breakdown of the $1,536 support level will invalidate the bullish narrative and, in some cases, push ETH down to $1,438.
Ripple price reveals bulls’ plans
Ripple price sliced through a demand zone, stretching from $0.547 to $0.568, as it dropped 12% from July 18. Despite this brutal sell-off, XRP price shows strong recovery signs as it hovers above the range low at $0.509.
While this recovery could likely originate from its current position, a dip that sweeps below $0.509 is also plausible.
Only a decisive 4-hour candlestick close above $0.568 will indicate the start of an uptrend. However, investors should wait for a secondary confirmation that will arrive after the remittance token creates a swing high above $0.590. If this were to happen, market participants could expect XRP price to rally another 6% to tag $0.627 and, in a highly bullish case, $0.647, coinciding with the trading range’s midpoint.
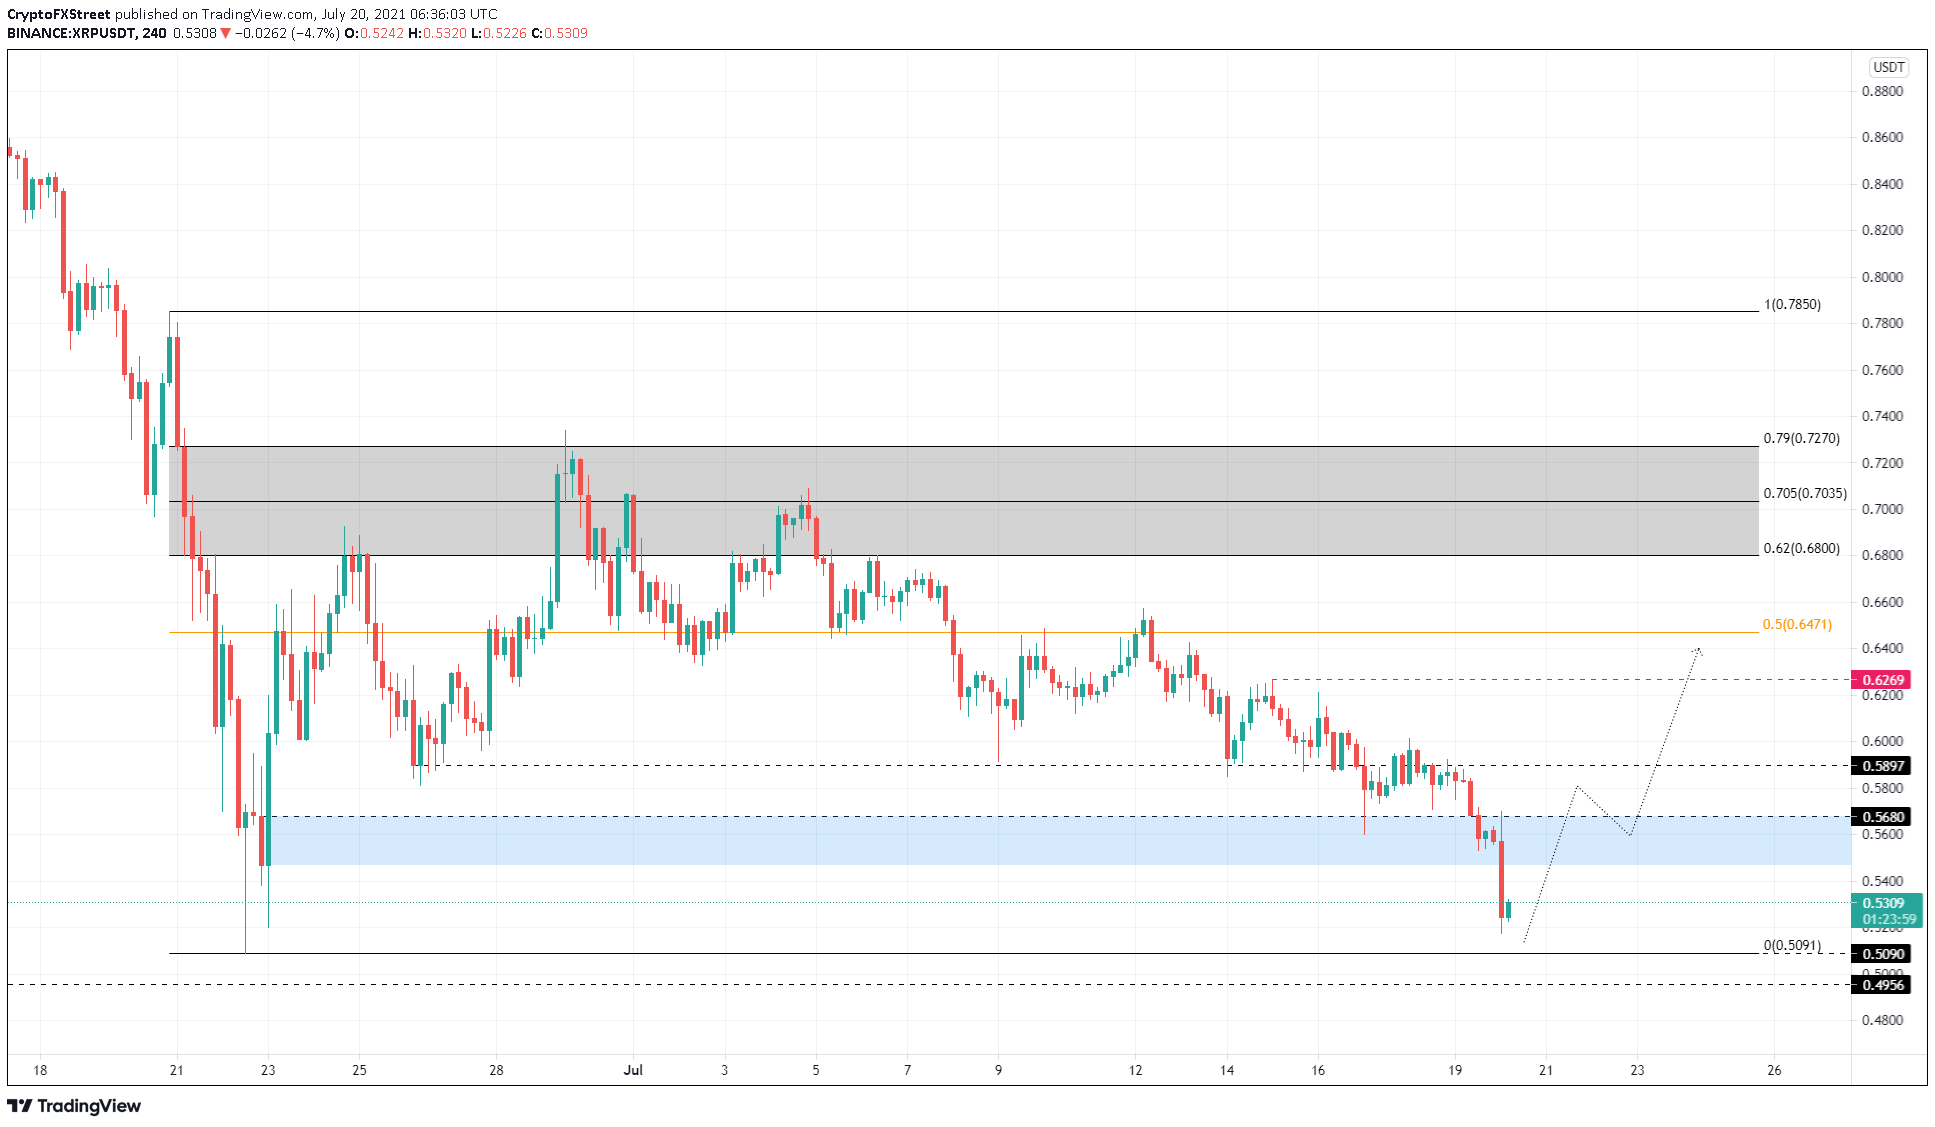
XRP/USDT 4-hour chart
While things seem to be going well for XRP price, a spike in selling pressure could quickly turn the tables. If Ripple slices through the range low at $0.509 and fails to reclaim it, it will denote weak buying pressure.
A decisive 4-hour candlestick close below the $0.496 support level will invalidate the bullish thesis.
Author

Akash Girimath
FXStreet
Akash Girimath is a Mechanical Engineer interested in the chaos of the financial markets. Trying to make sense of this convoluted yet fascinating space, he switched his engineering job to become a crypto reporter and analyst.


