Top 3 Price Prediction Bitcoin, Ethereum, Ripple: Crypto market red, but Simon says BTC may rally to $46,600
- Bitcoin price continues to outline a falling wedge pattern after closing the week down over -7%.
- Ethereum price building a descending triangle pattern with a 42% measured move.
- XRP price down -20% for the month and triggered a bearish Death Cross pattern on the daily chart.

Bitcoin is trading down near the psychologically important $30,000, but the governing pattern indicates that downside momentum has notably waned, and the flagship cryptocurrency is nearing an important reversal. Ethereum price is now down -20% after triggering an ascending wedge pattern on July 8, pushing it below the crucial support defined by the 2020 ascending trend line. XRP price continues to broaden the trading range, showing no spirit of reversing the downtrend as the June 22 low comes into view.
Bitcoin price narrative bullish, timing is close
Bitcoin price has remained below the 10-week simple moving average (SMA) for nine complete weeks, and based on today’s price action, it may reach ten weeks. The time below the moving average exceeds the seven weeks registered on the path to the March 2020 low. Therefore, this corrective process may be near a rebound based on the time below the moving average.
The deviation below the 10-week sma is -11.55%, but it reached -34.77% at the May low. At the March 2020 low, Bitcoin price fell -38.39% below the moving average, and at the December 2018 low, it reached -38.69%. Thus, on a relative basis, the sharpness and depth of the decline in May was similar to the other investable lows and did reflect a substantial level of panic within the BTC investor ranks.
By looking at Bitcoin price relative to the 10-week SMA, there is an argument that the momentum low (panic) was printed in May, and BTC is finalizing a price low. Moreover, the time below the moving average points to at least a double-digit rebound in the near future. The only issue is timing.
To address the timing, Bitcoin price has formed a falling wedge pattern (called Simon) during the corrective process, demonstrating evaporating downside momentum and the potential for a sharp, convincing rally to the upside. Currently, the 50-week SMA at $32,254 and the head-and-shoulders neckline provide support and prevent BTC from printing a new corrective low.
If the support area fails to hold, the Bitcoin price downside should be limited to approximately $27,000, thereby successfully testing the 61.8% Fibonacci retracement of the March 2020 to April 2021 advance at $27,175. A tag of $27,000 would be a 12% loss from the current price.
A daily Bitcoin price close above the wedge’s upper resistance line at $33,300 would be confirmation that the pattern has finally resolved to the upside and BTC should march towards the outstanding resistance around the 38.2% Fibonacci retracement of the April-June correction at $42,589. A daily close above the 10-week SMA at $34,759 would be additional confirmation for more cautious investors.
Overall, Simon says the upside price target is $46.646 or a gain of 50% from the current price.
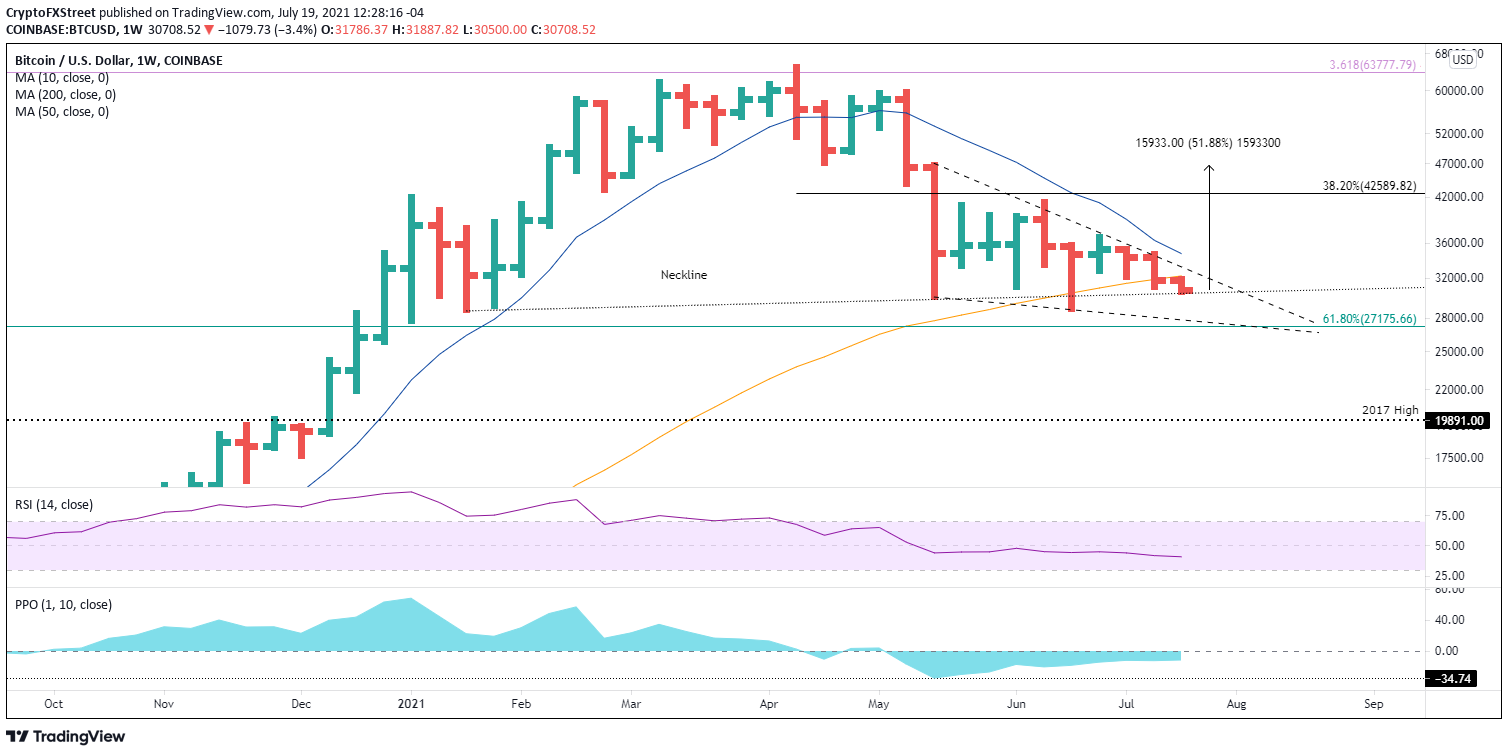
BTC/USD weekly chart
The emerging BTC narrative will be voided if Bitcoin price closes below the union of the wedge’s lower support line with the 61.8% Fibonacci retracement at $27,175 this week.
Ethereum price nearing a vulnerable position
On July 13, Ethereum price closed below a trifecta of support constructed by the confluence of the February high of $2,041 with the 200-day SMA at $2,036 and the 2020 ascending trend line at $1,984. It was the first daily close below the trend line after brief tests in June and marked an inflection point for ETH. Additionally, it lifted the probabilities of a deeper, more volatile decline.
Ethereum price closed the week below the ascending trend line, confirming the downward bias and presented ETH investors with an outlook that includes a test of the 61.8% Fibonacci retracement of the 2020-2021 advance at $1,730, the June 22 low of $1,700 and potentially, the 2018 high of $1,419. A drop to the 2018 high would represent a loss of 22% from the current price.
However, factoring in the improving Bitcoin price potential, ETH investors need to consider the possibility of a bear trap. More specifically, Ethereum price temporarily falls below the 2020 ascending trend line, creates fear and maybe tests $1,730 before staging a rapid recovery above the trifecta of support.
The upside potential for Ethereum price includes the 50-day SMA at $2,245 and the upper trend line of the larger descending triangle pattern (highlighted in blue) $2,510, achieving a 40% gain from $1,730.
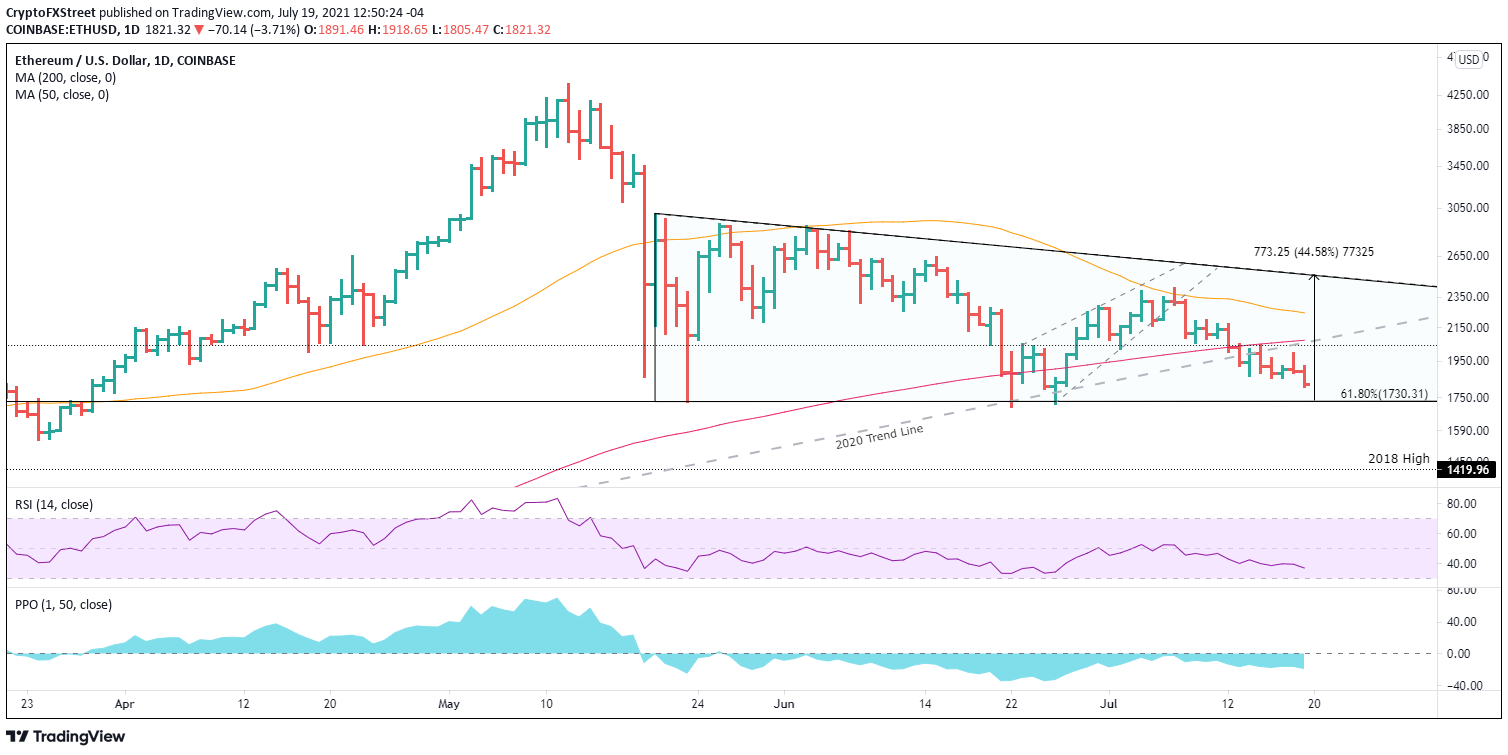
ETH/USD daily chart
So far, the break below the trifecta of support has not ignited a massive sell-off in Ethereum price, but it is important not to dismiss the inflection point presented by the ETH charts. The directional bias is down, and the cryptocurrency complex is still weighed down by selling pressure. As a result, wait for a daily close above the trifecta of support discussed above before engaging the market from the long side.
Here, FXStreet's analysts evaluate where ETH could be heading next.
XRP price now being impacted by a bearish pattern
XRP price is not testing the 78.6% Fibonacci retracement of the advance beginning the end of 2020 into the April high after failing to recapture the $0.650, a price level corresponding to the May 23 low and a series of highs going back to early 2021 and December 2020.
The Ripple price action since the breakdown from a rising wedge pattern on July 1 has not been impulsive, suggesting the oscillations of the cryptocurrency market are dictating the decline. However, a daily close below the retracement level will magnify the weakness and expose XRP price to a more significant decline with no support of note until the 200-week SMA at $0.457.
XRP price could be testing the lower edge of a trading range established by the 200-day SMA at $0.752, now reinforced by the Death Cross pattern, and the 78.6% retracement level at $0.555. Or, it is on the verge of a 15% collapse to the 200-week SMA.
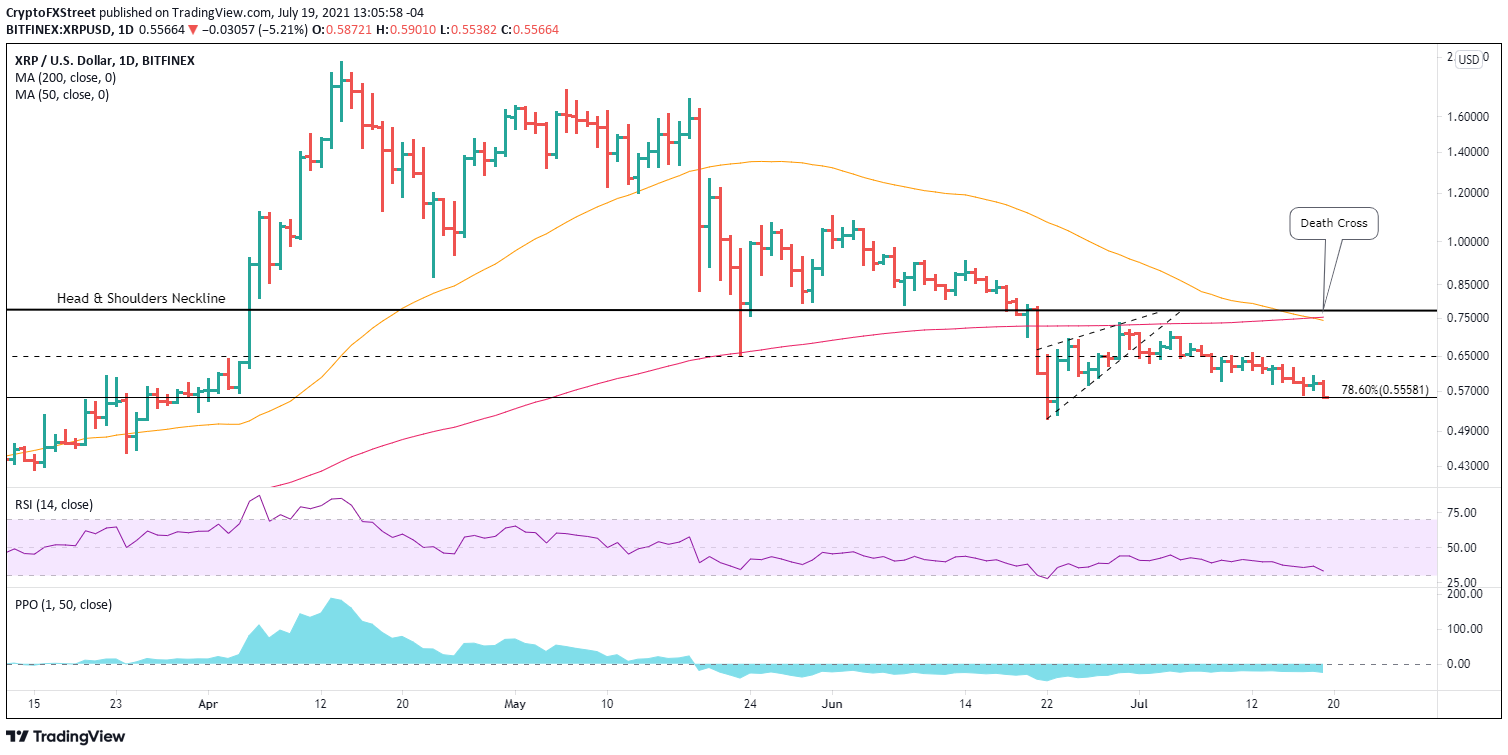
XRP/USD daily chart
It is challenging to dictate a bullish narrative when XRP price is just 8% above the June 22 low, and the entire market is decidedly bearish, so Ripple investors need to let the international settlements token prove itself before taking bold investment decisions.
Here, FXStreet's analysts evaluate where Ripple could be heading next.
Author

Sheldon McIntyre, CMT
Independent Analyst
Sheldon has 24 years of investment experience holding various positions in companies based in the United States and Chile. His core competencies include BRIC and G-10 equity markets, swing and position trading and technical analysis.


