The Graph Price Analysis: GRT holds firmly onto primary support ahead of technical breakout to $2
- The Graph embraces support at $1.6, hinting at recovery toward $2.
- A falling wedge pattern points GRT to a potential 20% upswing.
- The MVRV is in the buy zone as recovery comes into the picture.
- The MACD comprehensive outlook shows that the consolidation will take precedence.

The Graph extended the breakdown from the first week of March. The widespread declines on Monday saw GRT fall to the primary support at $1.6. The least resistance path is still downwards at the time of writing, but a rising wedge pattern hints at a breakout toward $2.
The Graph could consolidate breakout
The 4-hour chart shows the Moving Average Convergence Divergence (MACD) moving horizontally under the mean line. If the trend momentum indicator remains in the same position, the dominating trend will be sideways in the near term.
The 4-hour chart has printed a falling wedge pattern on the 4-hour chart. A breakout is anticipated in the coming sessions as long as the support at $1.6 holds. Trading above the 100 Simple Moving Average (SMA) would cement the bulls’ influence over the price as gains to $2 come into play.
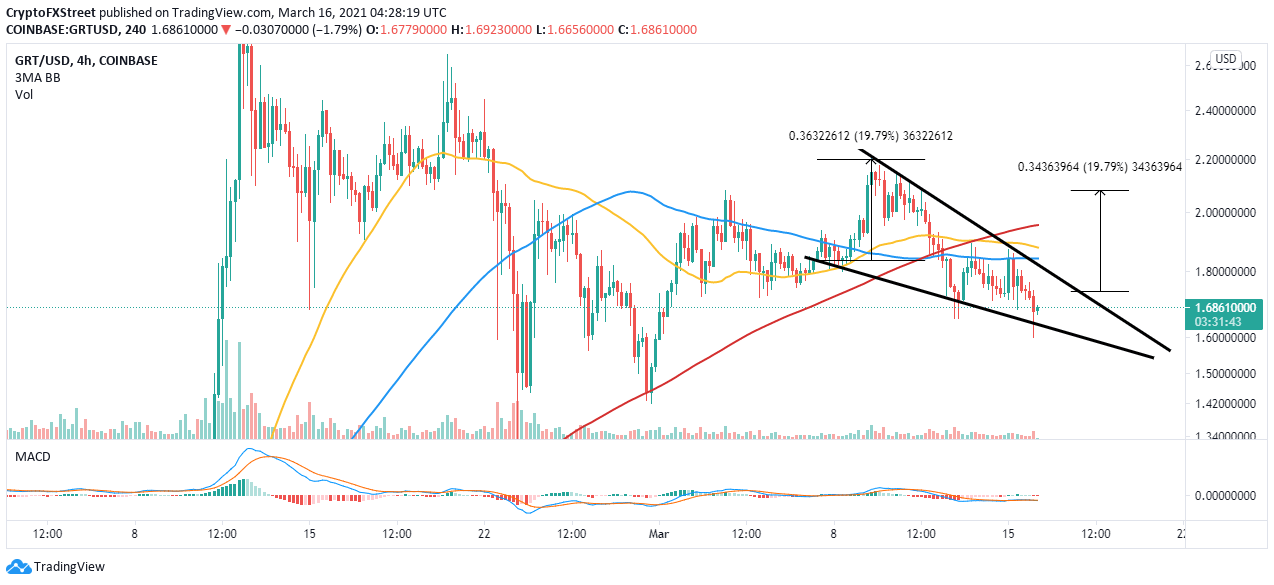
GRT/USD 4-hour chart
The MVRV, an on-chain metric by IntoTheBlock, suggests that The Graph in a buy zone. This metric measures the profit or loss of holders of GRT by tracking the tokens “moved in the last 30 days, based on the price when each token last moved.” An MVRV ratio of less than 1.0 reveals that most of the holders at a loss. For instance, GRT has an MVRV ratio of -8.9%, which means investors are unlikely to sell.
%20[08.12.59,%2016%20Mar,%202021]-637514687351701945.png)
The Graph MVRV model
Looking at the other side of the fence
It is worth noting that support at $1.6 is key to the recovery. However, if lost, massive sell orders would be triggered. On the downside, the next robust support holds at $1.45. More buyers are expected to come in at this level and contribute to the tailwind.
Author

John Isige
FXStreet
John Isige is a seasoned cryptocurrency journalist and markets analyst committed to delivering high-quality, actionable insights tailored to traders, investors, and crypto enthusiasts. He enjoys deep dives into emerging Web3 tren


