The Graph Price Forecast: GRT sellers threaten a 25% drop if this key level is breached
- The Graph price is consolidating in an ascending parallel channel, indicating a breakdown of the setup soon.
- A 25% correction to $1.22 is possible if GRT slices through the channel’s lower trendline.
- However, a decisive close above the 50, 100, and 200 moving averages (MA) could reignite an optimistic scenario.

The Graph price has been on a severe downtrend since hitting a local top at $2.19. Now, GRT could continue its descent as selling pressure builds up.
The Graph price eyes a lower low
The Graph price has printed higher highs and higher lows since February 28. An ascending parallel channel pattern seems to form by connecting the swing highs and swing lows using trendlines.
Since hitting the local top at $2.18, GRT has dropped nearly 20%, showing a weakening buying power. If the bulls fail to defend the channel’s lower trendline, the technical formation forecasts a 25% drop to $1.22.
Supporting this bearish outlook is 50, 100, and 200 four-hour moving averages present above the current price action. These indicators pose as a supply barrier, thus preventing GRT from trending higher.
Therefore, a rejection from any of the above-mentioned moving averages leading to a decisive 4-hour candlestick close below $1.73 will trigger a correction to $1.22.
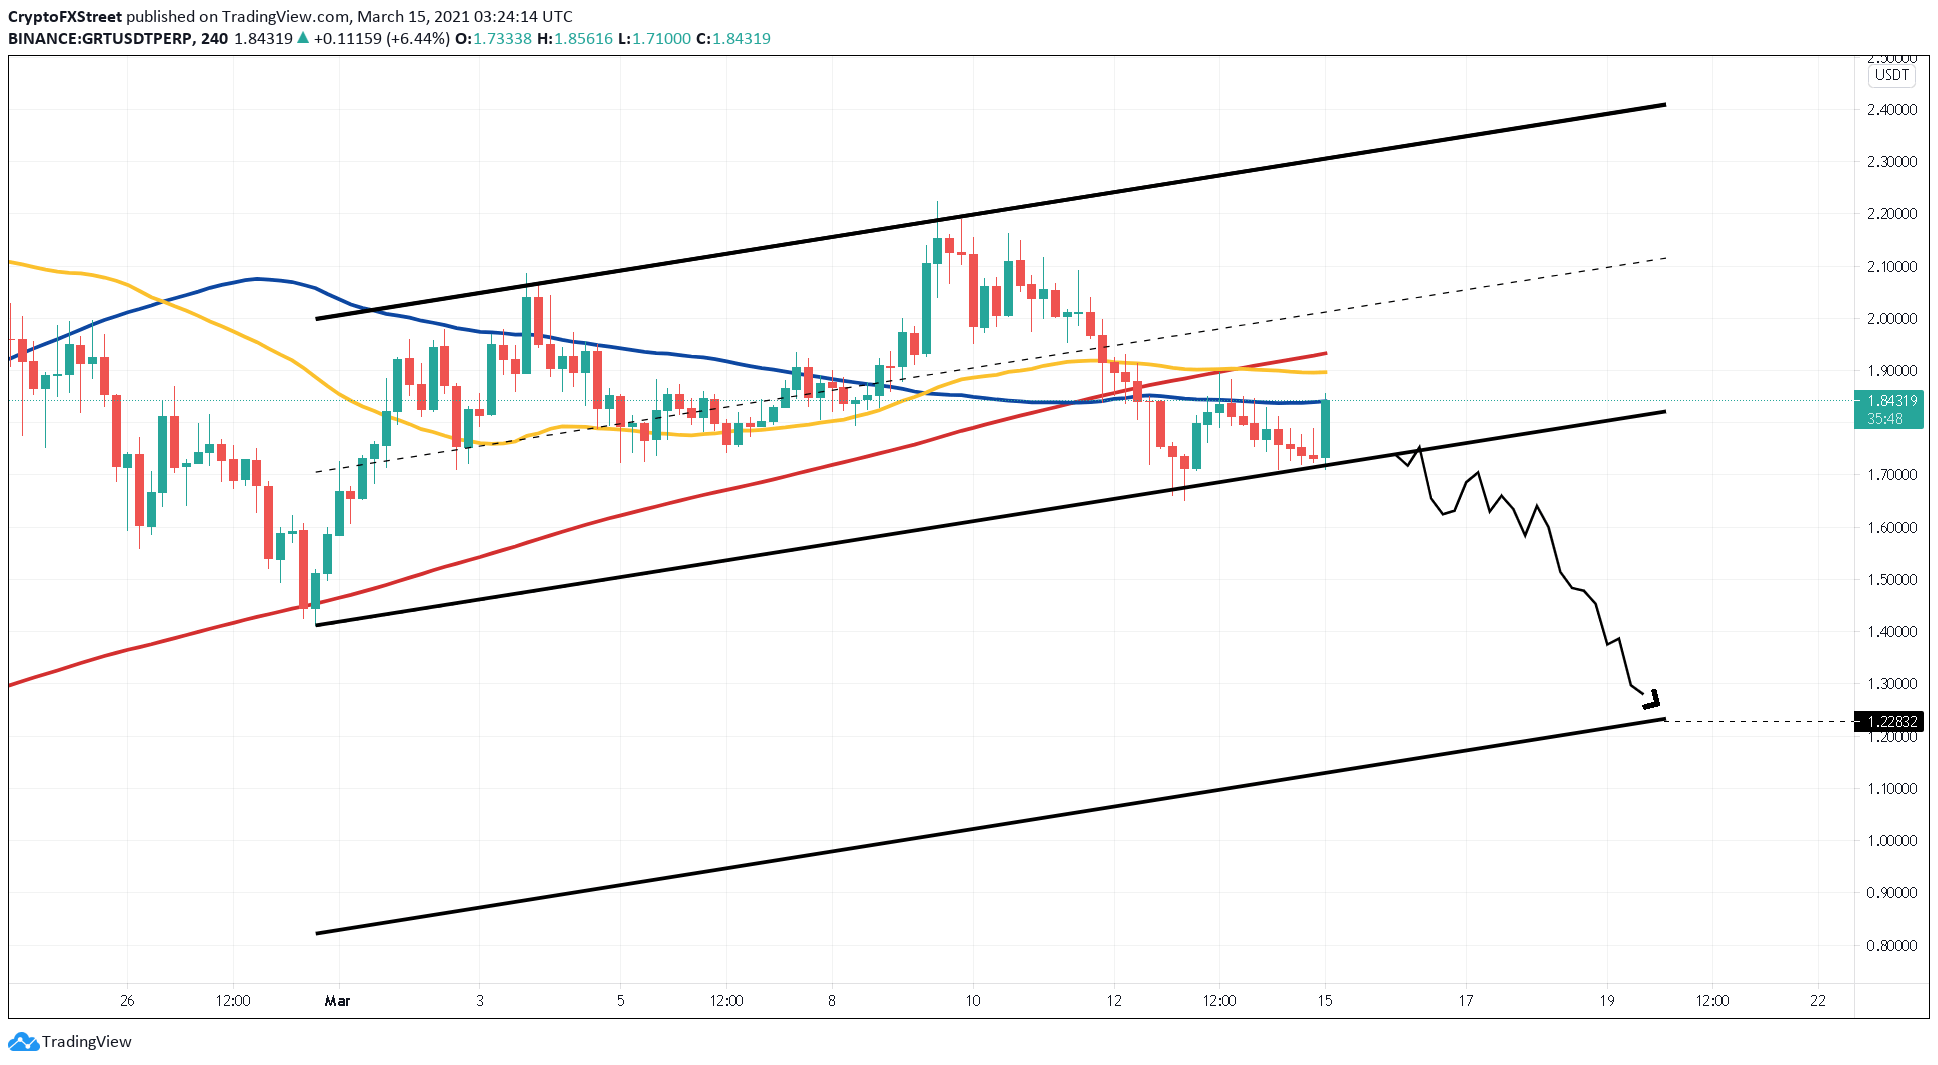
GRT/USDT 4-hour chart
Adding credence to this pullback is the non-existent support levels as indicated by IntoTheBlock’s In/Out of the Money Around Price (IOMAP) model. However, IOMAP cohorts reveal massive resistance from “Out of the Money” investors present at $2.04. Here, roughly 2,700 addresses purchased nearly 155 million GRT tokens.
Therefore, an upswing will face massive blockade as these investors might sell their holdings and break-even.
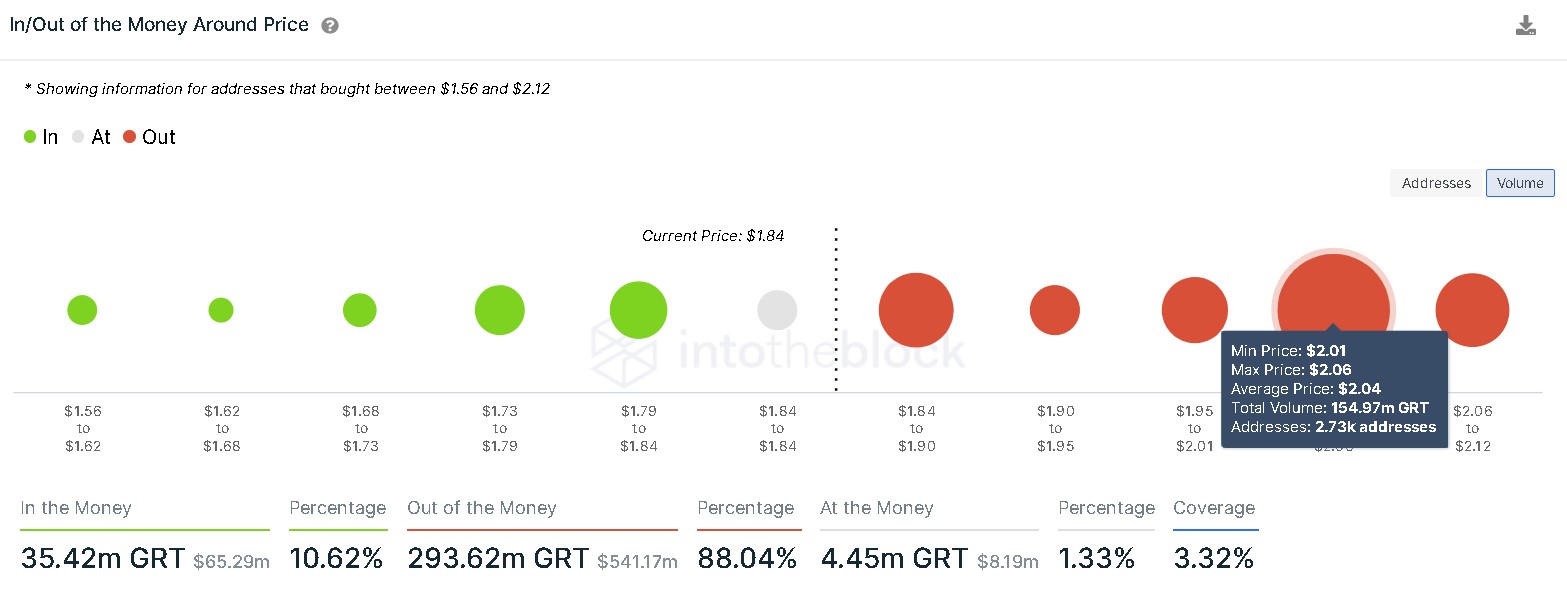
The Graph IOMAP chart
On the flip side, a sudden spike in buying pressure leading to a 4-hour candlestick close above the 200 MA at $.94 will invalidate the bearish outlook. In this scenario, the Graph price might surge 20% to retest the ascending parallel channel’s upper trendline at $2.34.
Author

Akash Girimath
FXStreet
Akash Girimath is a Mechanical Engineer interested in the chaos of the financial markets. Trying to make sense of this convoluted yet fascinating space, he switched his engineering job to become a crypto reporter and analyst.


