The Graph Price Prediction: GRT inches closer to an 85% lift-off
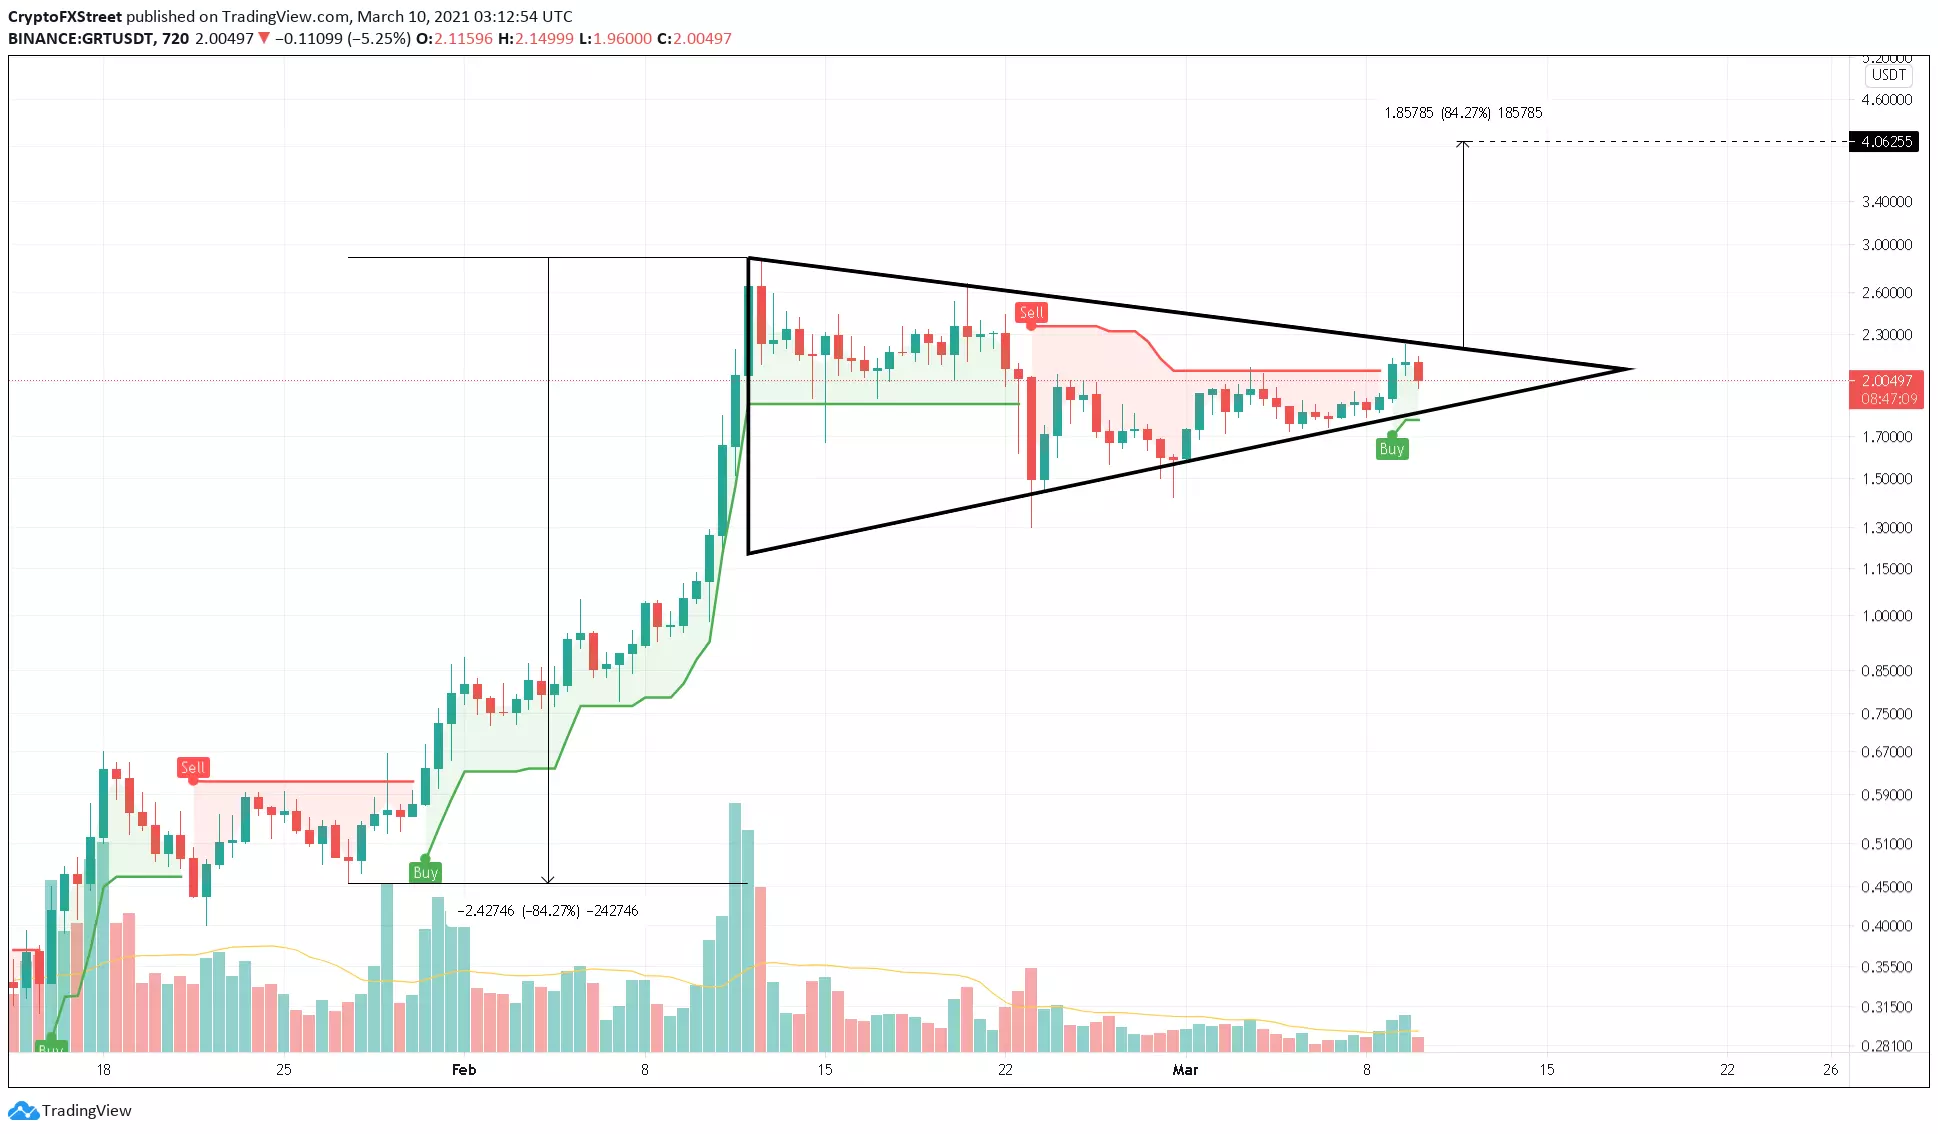
- The Graph price is consolidating in a continuation pattern known as “bullish pennant.”
- GRT could experience an 85% upswing after a successful breakout.
- A bearish scenario might develop if GRT slices through the pennant’s lower trendline at $1.85.

The Graph price shows a bullish bias as a technical indicator flashed a buy signal recently. If buyers continue to pile up, then a massive bull rally can be expected.
The Graph price begins countdown
The Graph price is traversing a continuation pattern known as “bullish pennant.” This setup includes an initial 535% run-up known as “flag pole,” followed by a consolidation in a “pennant” since February 12.
The technical formation forecasts an 85% upswing, identified by measuring the flag pole’s height and adding it to the breakout point at $2.20. This target places GRT at $4.06.
Supporting this upswing is the buy signal that was printed on March 9. Therefore, a 12-hour candlestick close above the pennant at $2.20 seals GRT’s bullish fate.
GRT/USDT 12-hour
On the other hand, investors should pay attention to IntoTheBlock’s In/Out of the Money Around Price model, which shows 2,750 addresses that purchased roughly 164 million GRT at an average price of $2.06 are “Out of the Money.” So, short-term bullish momentum could be absorbed by these investors who might want to break-even.

The Graph IOMAP chart
Therefore a sudden spike in selling pressure at $2.06 could lead to a correction towards the pennant’s lower trendline at $1.85. However, a breakdown of the consolidation will invalidate the bullish thesis and trigger a correction towards the next immediate support around the $1.58 level.
Author

Akash Girimath
FXStreet
Akash Girimath is a Mechanical Engineer interested in the chaos of the financial markets. Trying to make sense of this convoluted yet fascinating space, he switched his engineering job to become a crypto reporter and analyst.


