Stellar Price Analysis: XLM faces uphill battle as selling pressure mounts
- Stellar price is currently bounded inside a symmetrical triangle pattern on the 12-hour chart.
- The digital asset has bounced off the lower trendline support level and aims for $0.185.
- On-chain metrics suggest that XLM could be poised for a major correction.

After setting a high at $0.233 on November 25, Stellar entered a period of consolidation and remains trading inside a tightening pattern on the 12-hour chart. Several indicators present conflicting data favoring bears and bulls.
Stellar price could jump to $0.185 before a major correction
Stellar is contained inside a symmetrical triangle pattern on the 12-hour chart. The digital asset has just defended the lower trendline support level at $0.165 and aims to rebound higher. The bulls need to reconquer the 50-SMA level as support.
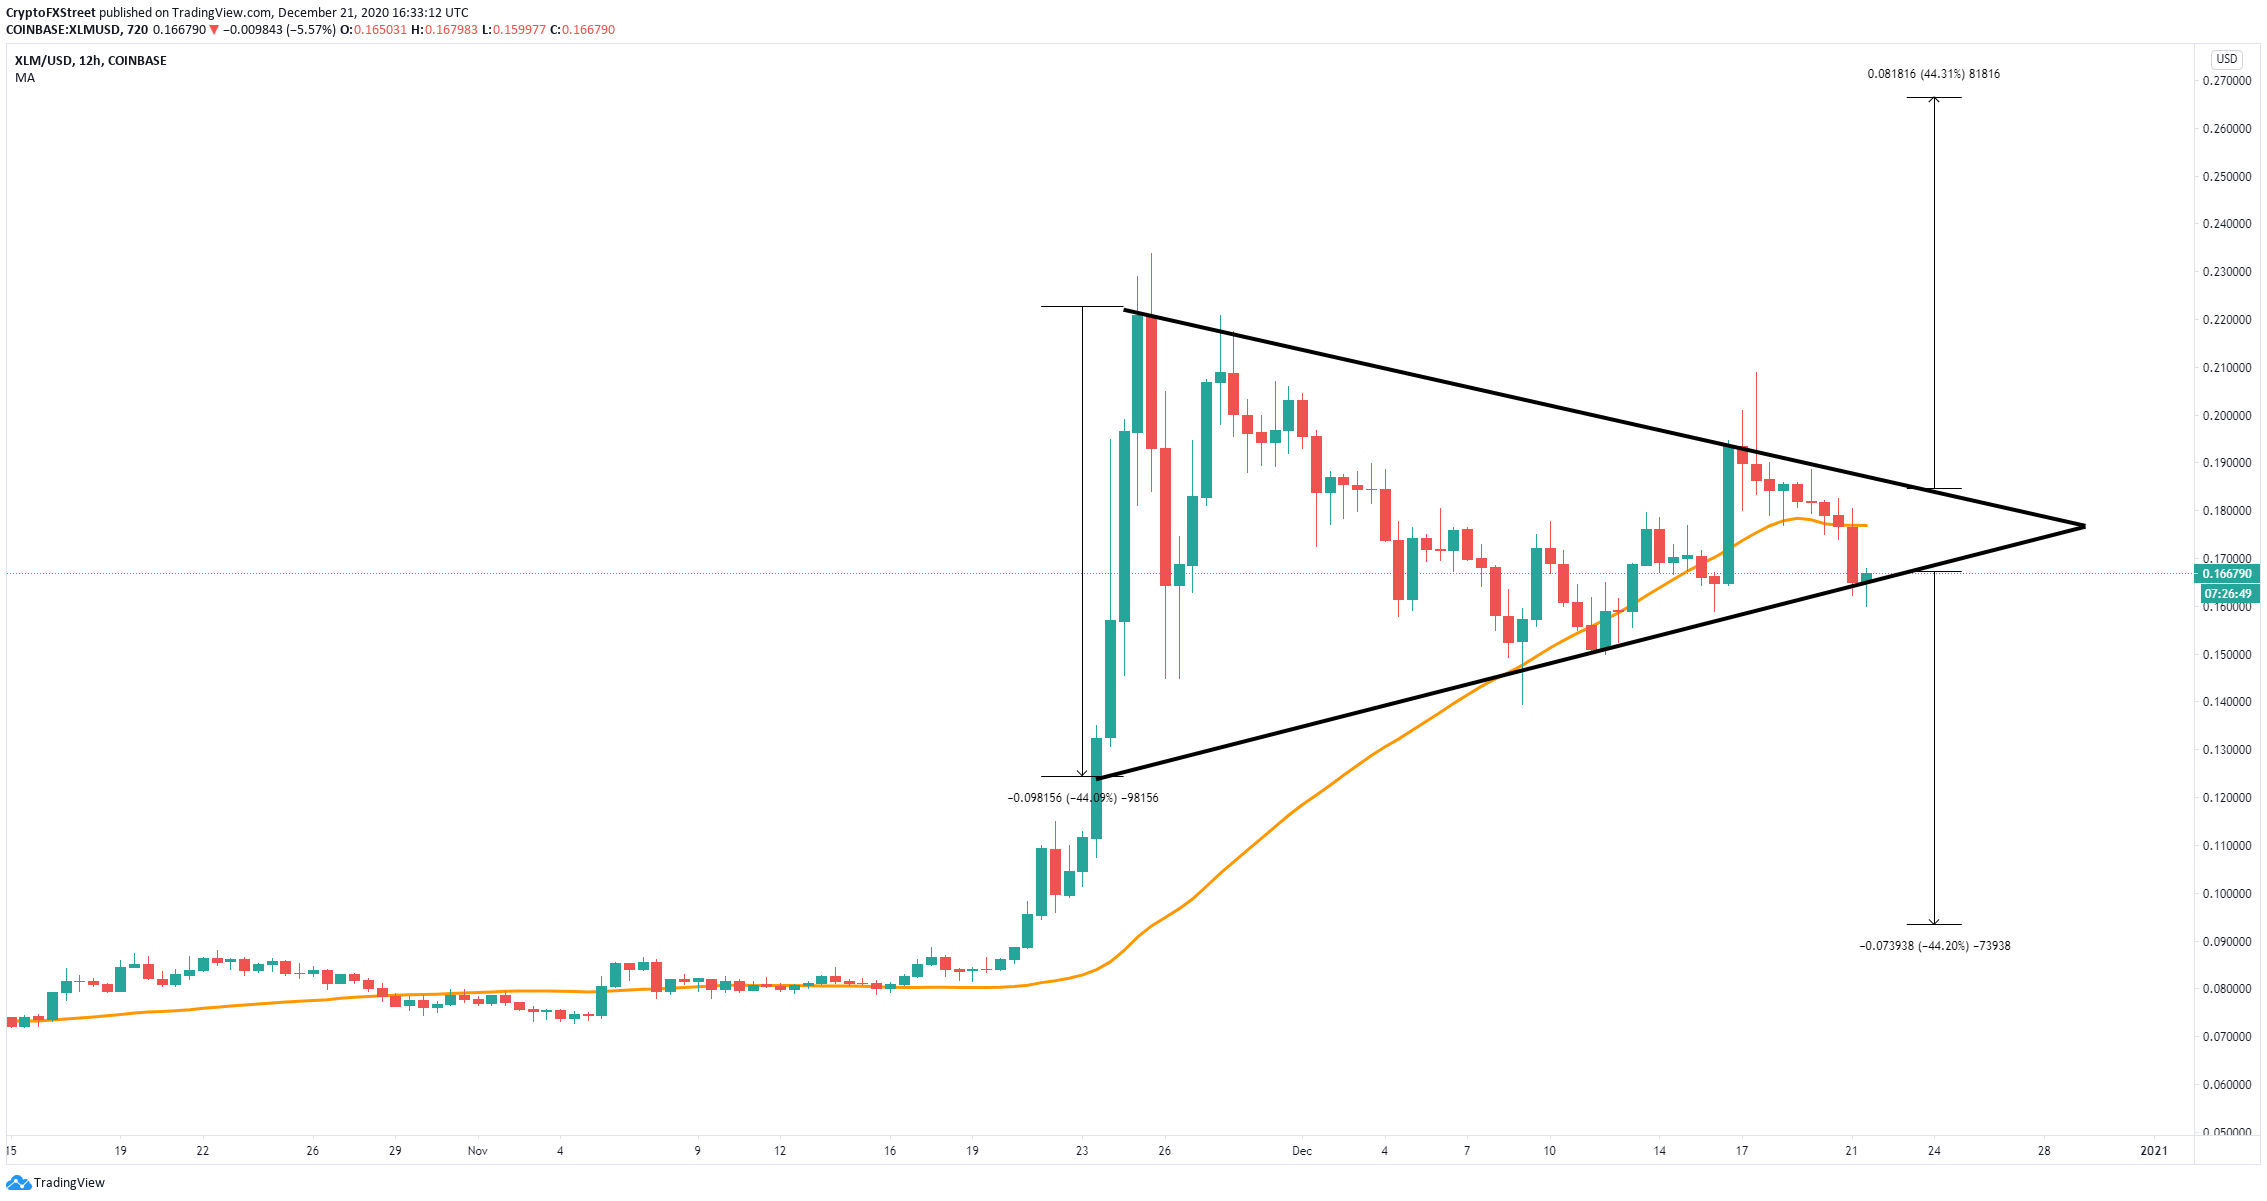
XLM/USD 12-hour chart
Pushing through the 50-SMA will most likely lead XLM towards the upper trendline resistance level. A breakout above this point can quickly drive Stellar price towards $0.27, a 44% jump using the height of the pattern as a reference point.
However, it seems that the 30-day volatility metric has jumped to levels not seen since January 2018 when Stellar experienced a massive correction from its all-time high at $0.88. The metric could be hinting at another potential major pullback for XLM.
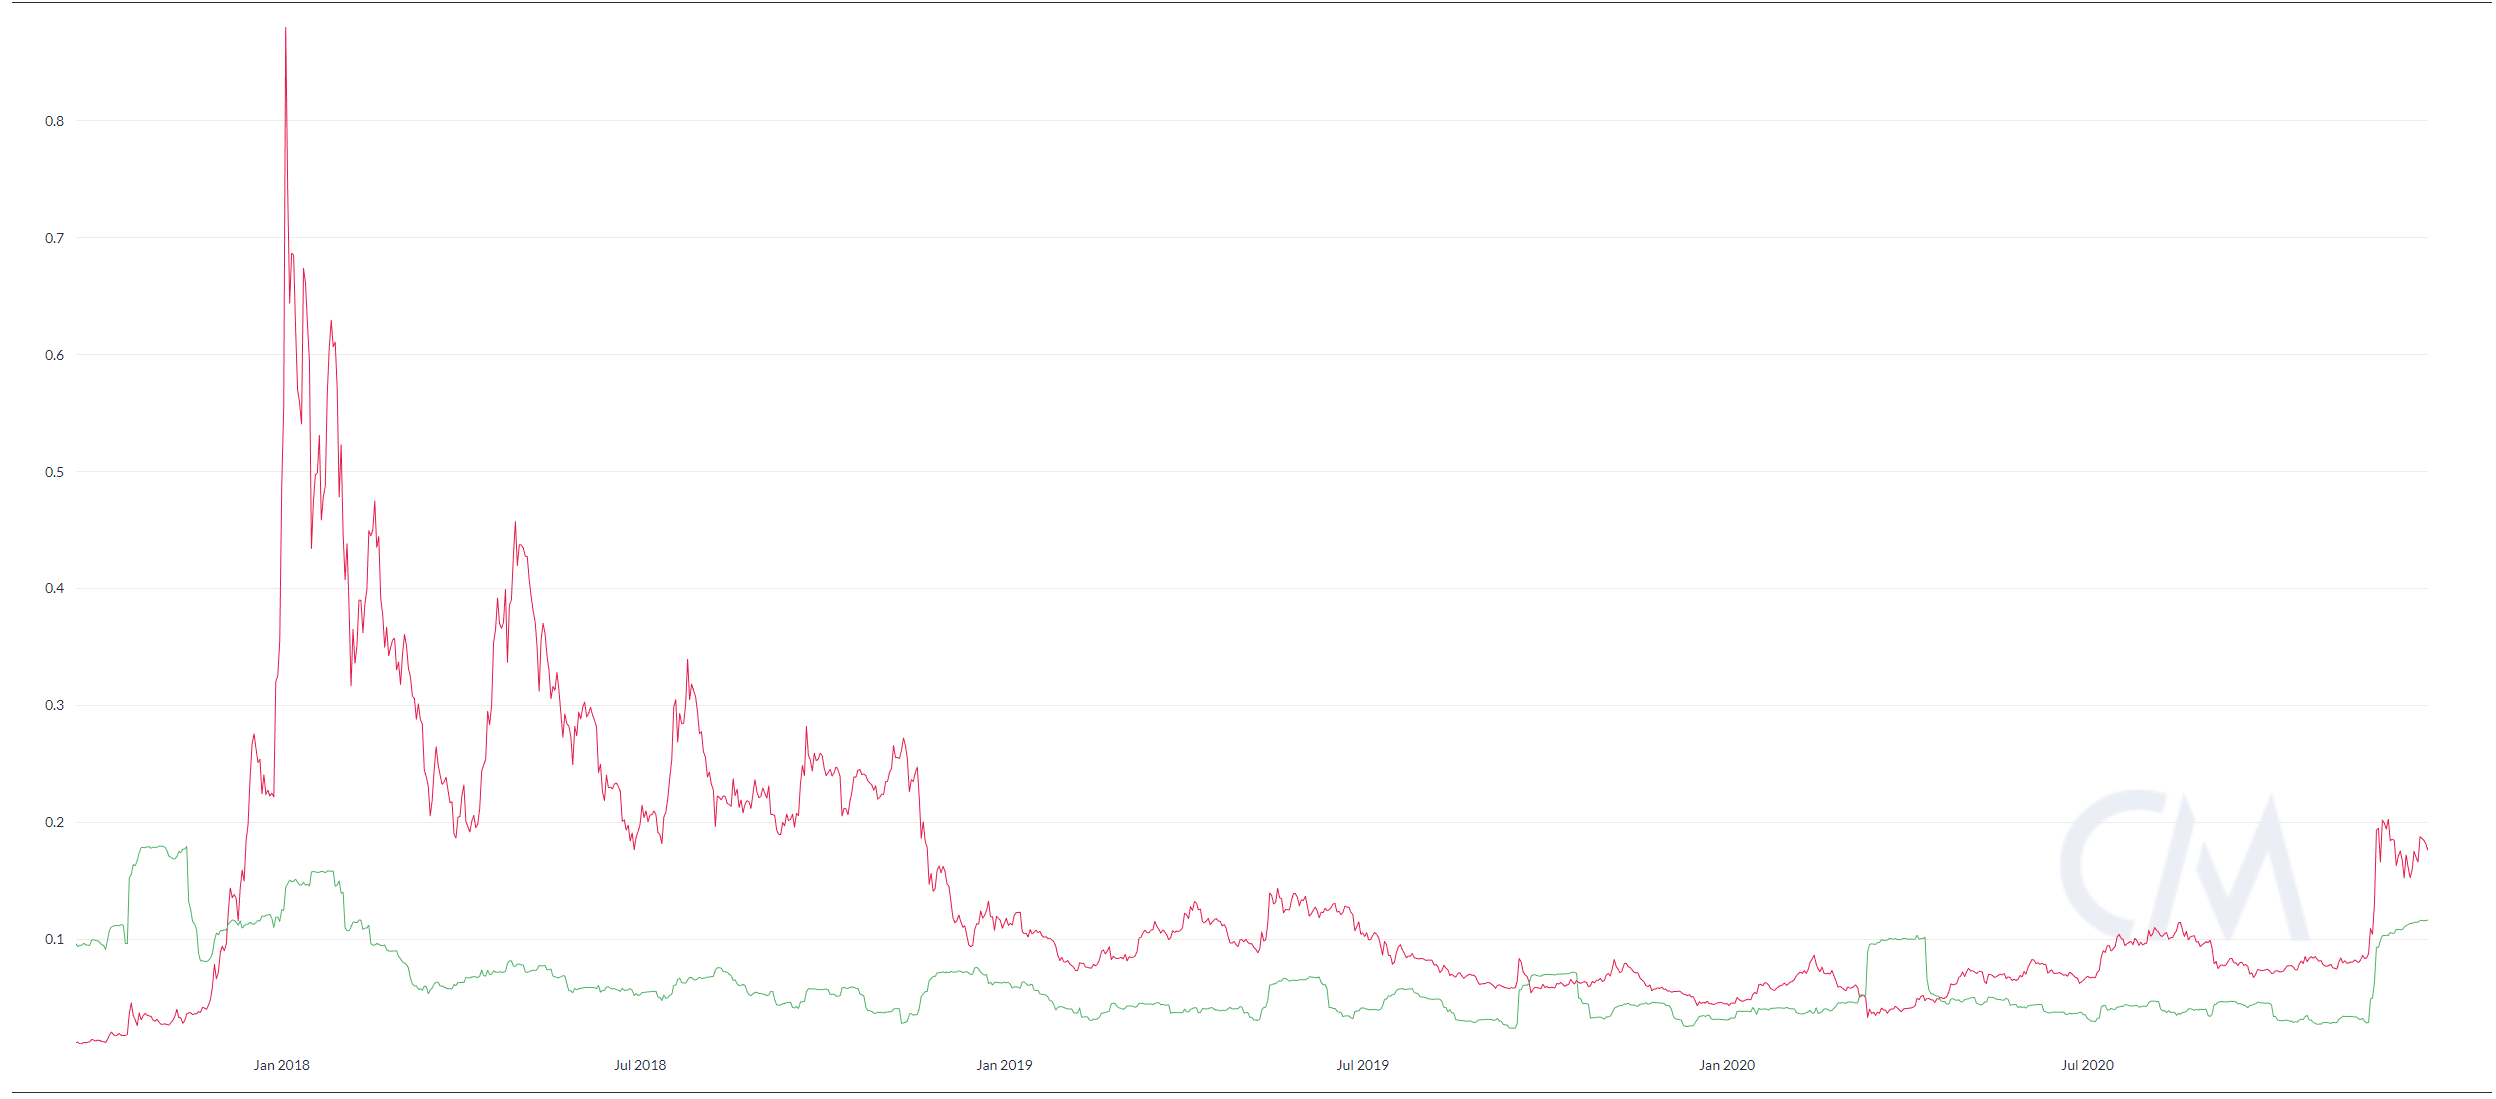
XLM 30-day volatility chart
Bears have managed to push Stellar price below the 50-SMA and the digital asset might be on the verge of a breakdown below the critical support level at $0.165. Losing this level will push XLM down to $0.093.
Author

Lorenzo Stroe
Independent Analyst
Lorenzo is an experienced Technical Analyst and Content Writer who has been working in the cryptocurrency industry since 2012. He also has a passion for trading.


