XLM Price Prediction: Stellar could dive another 22% after slicing through this crucial support
- Stellar slumps under the ascending triangle pattern, validating a potentially massive downfall to $0.13.
- A sell signal on the weekly chart adds credence to the bearish formation, suggesting that bears will remain in control.

Stellar has recently been rejected at $0.18, which seems to have opened the Pandora box for losses towards $0.13. The bearish outlook appears to have been validated after the price slipped under the ascending trendline on the 4-hour chart.
Stellar faces resistance as bears swing into action
XLM/USD is trading at $0.164 at the time of writing. The cross-border token’s immediate upside has been capped under the 50 Simple Moving Average. A bearish outlook came into the picture after Stellar dived under the hypotenuse of an ascending triangle.
A horizontal line is usually drawn along with the swing highs, while a rising trendline formed along with the swing lows.
A recent spike in selling pressure due to the rejection at $0.18 broke the support as mentioned. For now, Stellar may spiral 22% from the breakdown point based on the ascending triangle formation. This target is determined by measuring the distance between the two highest points of the triangle and adding it to the breakout point.
%20(14)-637437011264651302.png)
XLM/USD 4-hour chart
A sell signal was recently presented by the TD Sequential indicator on the weekly chart. The call came after Stellar hit a barrier at $0.234 following a majestic rally that commenced in November.
The bearish outlook manifested in a green nine candlestick. A reversal is already underway but could also continue further and even risk pushing XLM back to the drawing board at the 100 SMA and the 50 SMA.
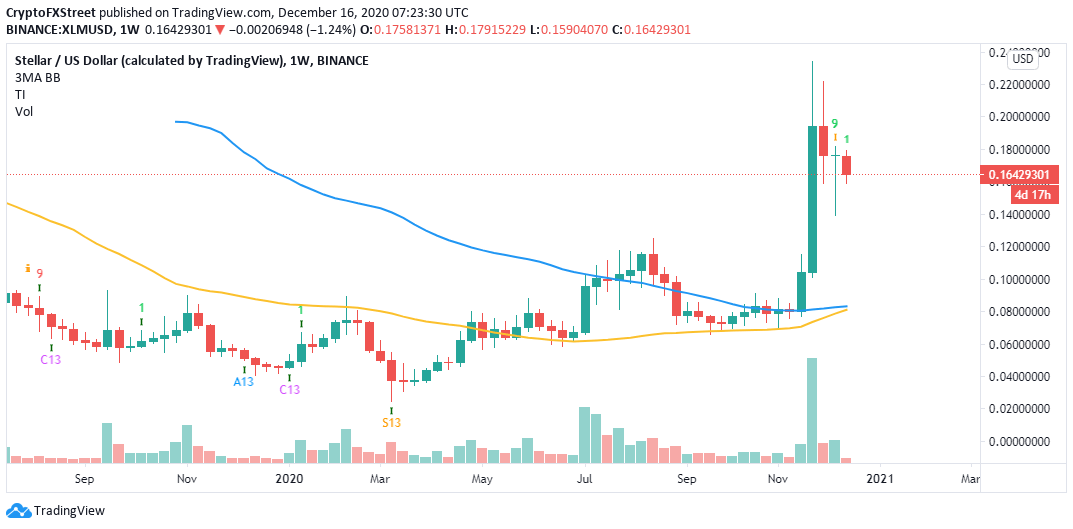
XLM/USD weekly chart
It is worth noting that a rebound may come into play from the short-term support at $0.16. Moreover, closing the day above the 50 SMA on the 4-hour chart would call the bulls to increase positions in anticipation of recovery towards $0.2. Price action above the hypotenuse might elevate Stellar to price levels as high as the peak in November.
Author

John Isige
FXStreet
John Isige is a seasoned cryptocurrency journalist and markets analyst committed to delivering high-quality, actionable insights tailored to traders, investors, and crypto enthusiasts. He enjoys deep dives into emerging Web3 tren




