Solana struggles to hold support as bears prepare to drive SOL to $50
- Solana price threatens to break out below a bear flag on its daily Ichimoku chart.
- Buyers are unwilling or unable to support SOL.
- Long and short opportunities now exist for both sides of the market.

Solana price has been unable to maintain support at $125, $115, $100, and now it appears like $90 will fail to hold as support as well. Bearish continuation patterns point to continued selling pressure and a probable return to the $50 value area if buyers fail to appear.
Solana price develops long and short opportunities on its Point and Figure chart – SOL is weighted more to the bears' favor than the bulls
Solana price action on the Point and Figure charts provides a more clear view of what is happening with SOL. Point and Figure charting reduces the 'noise' that candlesticks are famous for and restricts the data to price only; no time factor is involved. As a result, two trading opportunities are developing for the long and short sides of the market.
The theoretical long setup is a buy stop order at the three-box reversal ($100 at the time of publishing), the stop loss is a 4-box stop ($90 at the time of publishing), and the profit target is $145. The trade idea represents a 4.5:1 reward/risk. A three-box trailing stop would help protect any profit made post entry.
The long setup is based on re-entry from a trend change. The current O-column is the first reversal/pullback since the conversion from a bear market to a bull market on the $2.50/3-box reversal Point and Figure chart. The initial pullback is viewed as a sign of strength, not weakness. As Solana price moves lower, the entry and stop-loss adjust as needed – but the profit target remains at $145.
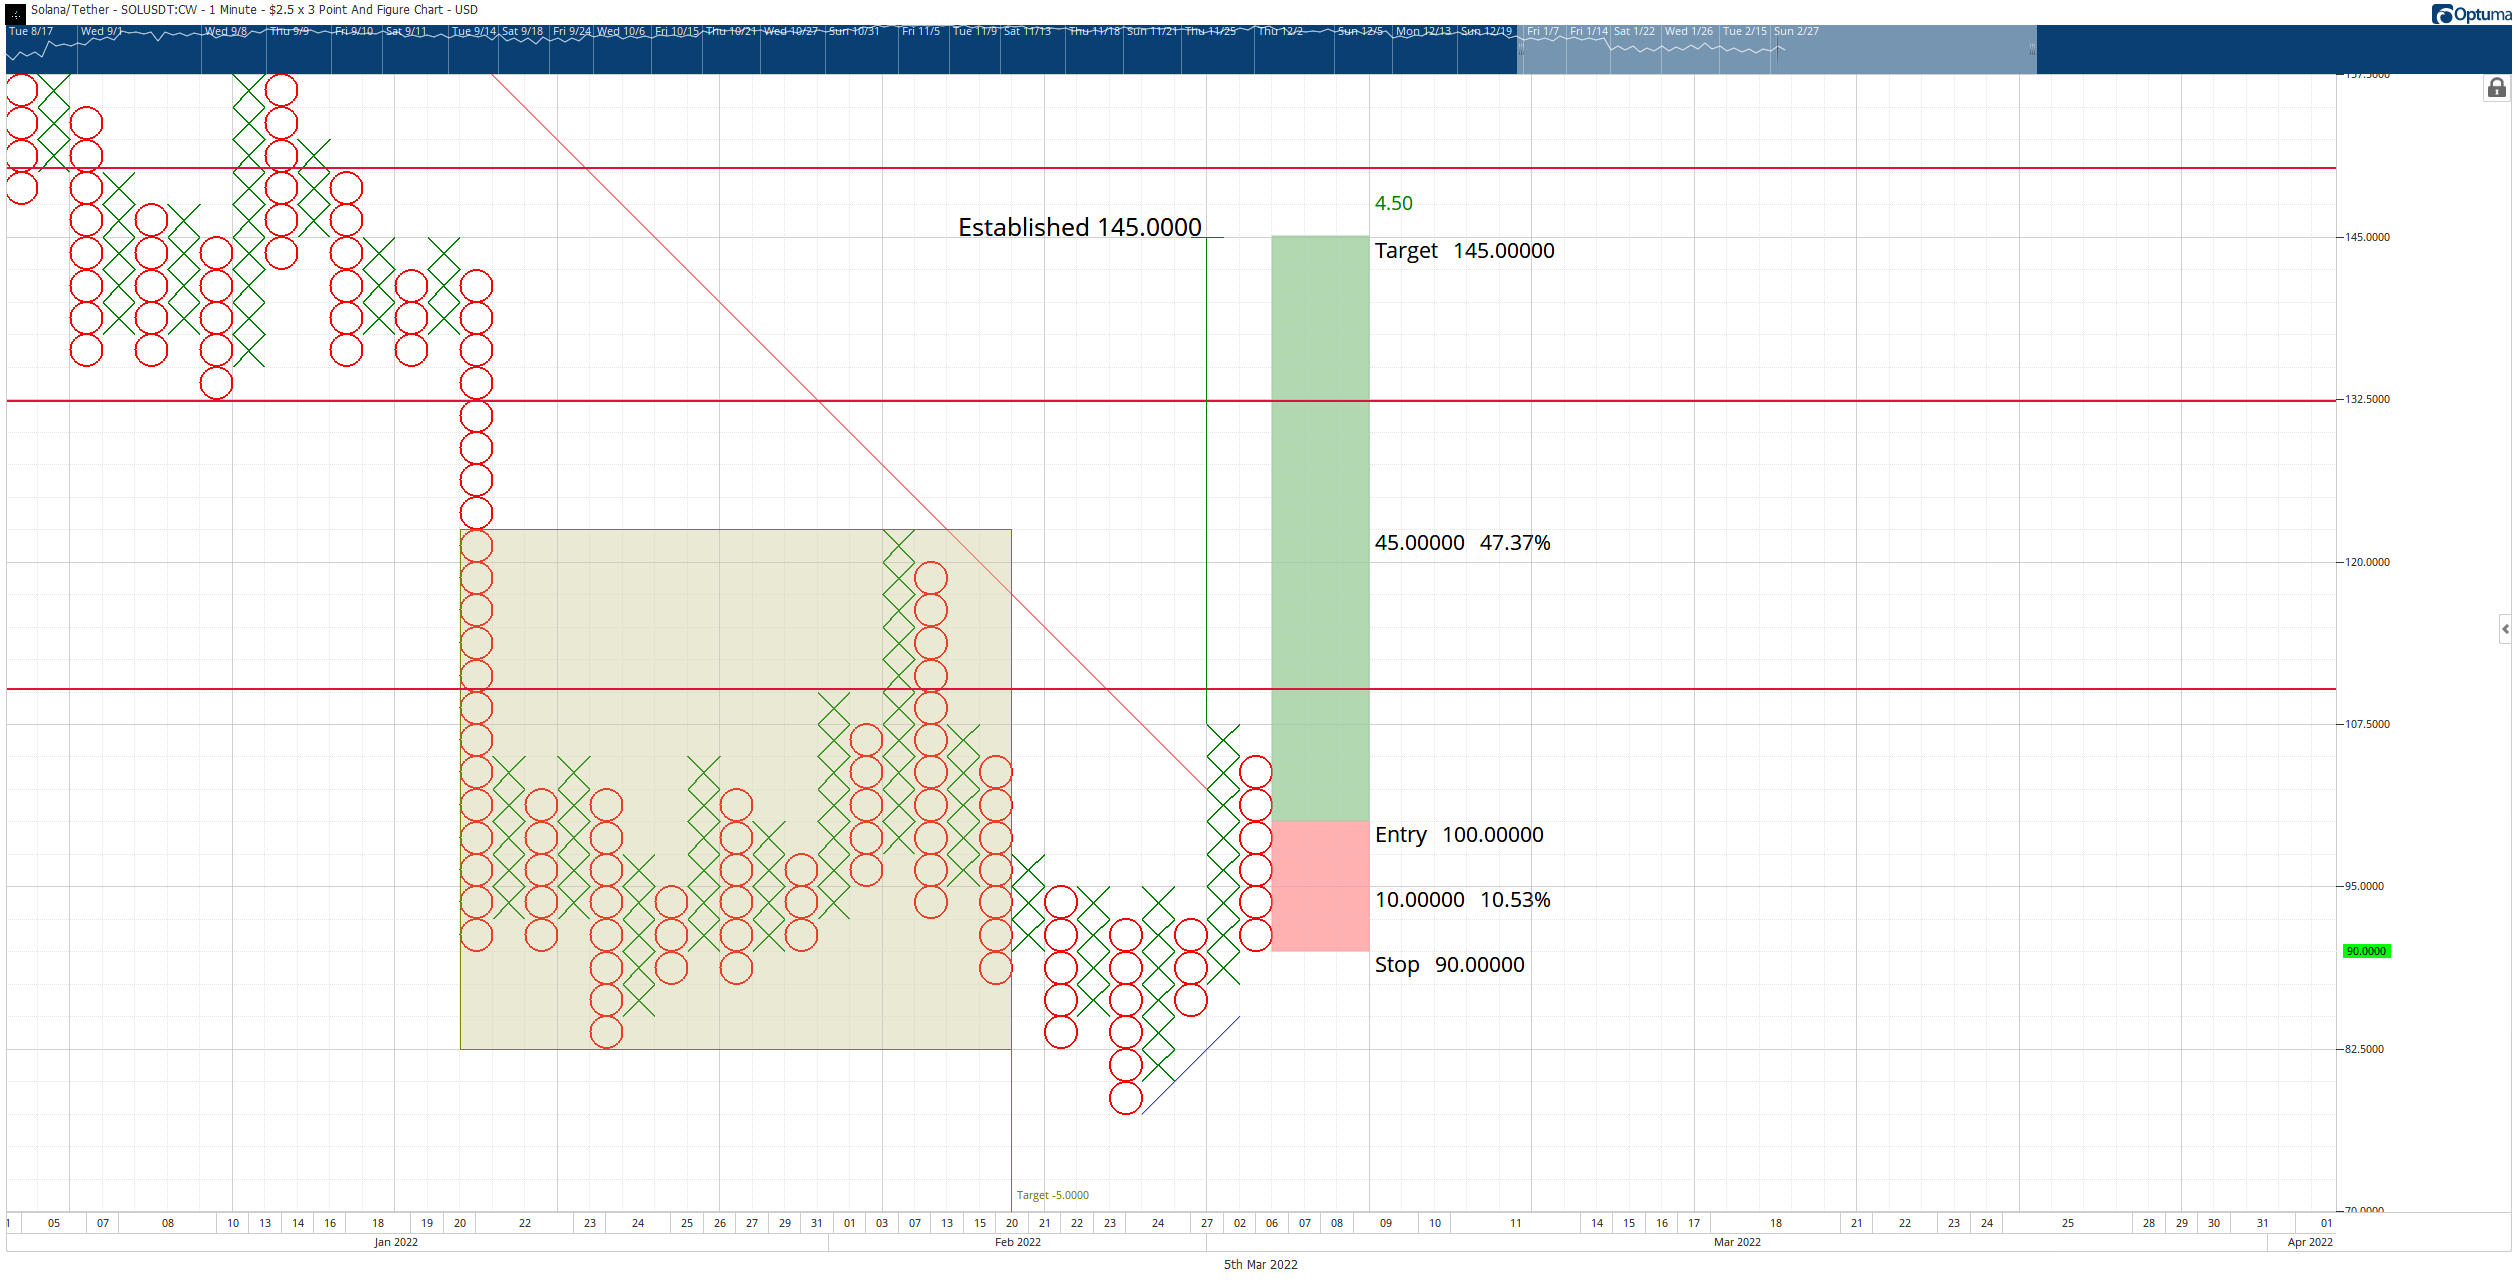
SOL/USD $2.50/3-box Reversal Point and Figure Chart
The long entry is invalidated of SOL price moves to or below $80.
On the short side of the trade, there is a hypothetical short entry for Solana price with a sell stop order at $82.50, a stop loss at $92.50, and a profit target at $50. The caveat with this entry is that it must be a triple bottom breakout, not just a double bottom. That means upon hitting $85, Solana price will need to create another column of Xs and then reverse again. If the short entry triggers, Solana also returns bear market conditions its Point and Figure Chart.
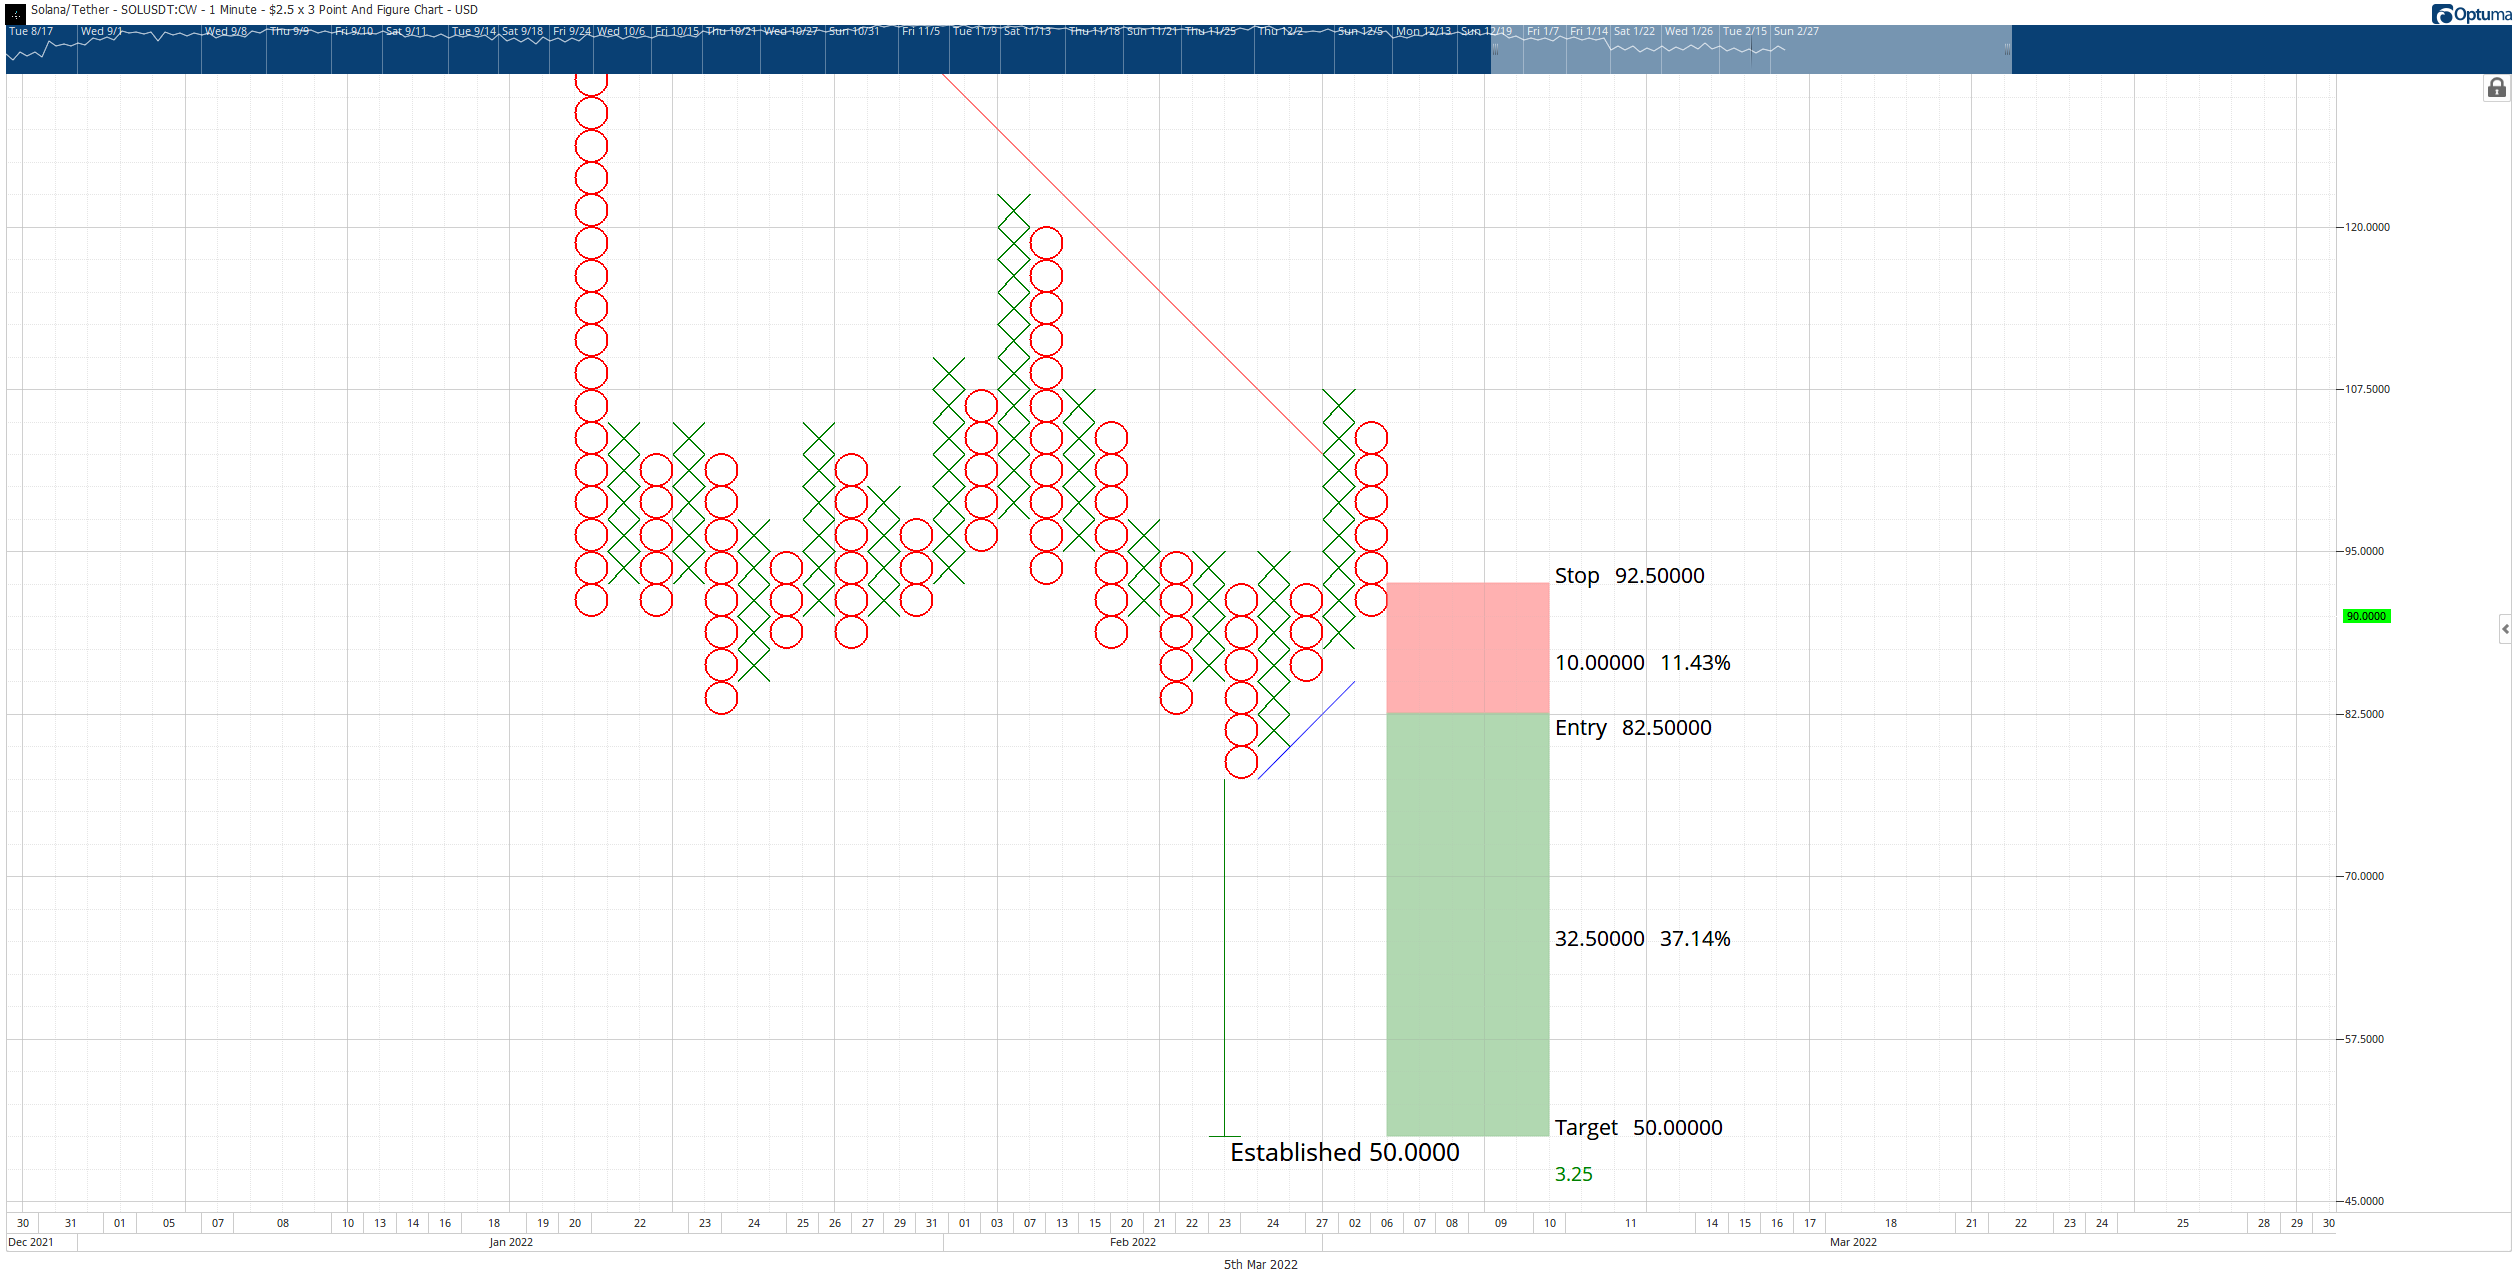
SOL/USD $2.50/3-box Reversal Point and Figure Chart
The hypothetical short entry setup is invalidated if Solana price closes at or above $100.
Author

Jonathan Morgan
Independent Analyst
Jonathan has been working as an Independent future, forex, and cryptocurrency trader and analyst for 8 years. He also has been writing for the past 5 years.