Solana price moves past the halfway point of its 40% ascent to $115
- Solana price has bounced off the $65.91 to $82.00 demand zone, triggering a 40% ascent.
- A minor retracement to $93.29 seems likely before SOL rallies to $115.
- A daily candlestick close below $65.91 will invalidate the bullish thesis.

Solana price has executed an impressive bounce over the last week after finding its feet at a crucial support area. This upside move has passed the halfway point of its journey, confirming a healthy uptrend.
Solana price to continue its climb
Solana price bounced off the $65.91 to $82.00 demand zone on February 23 and rallied 28%. This move set a swing high at $105.26 after slicing through the $93.29 and $101.94 resistance barriers, indicating a strong gust of buying pressure.
While impressive, there is a good chance SOL will pull back, allowing bulls to recuperate their strength for the next leg-up. Suitable candidates for the endpoint of this retracement include the $101.94 and $93.29 barriers.
A bounce off either of these levels will provide a perfect play for interested investors looking to go long. The next stop for Solana price for its second leg includes the $110.03 resistance barrier – clearing it will open the path for SOL to retest the bearish breaker, extending from $115.51 to $144.70.
In some cases, Solana price could extend the run-up to the $135.71 weekly resistance barrier residing inside the said breaker. Investors can choose to book profits at $115.51 or $135.71.
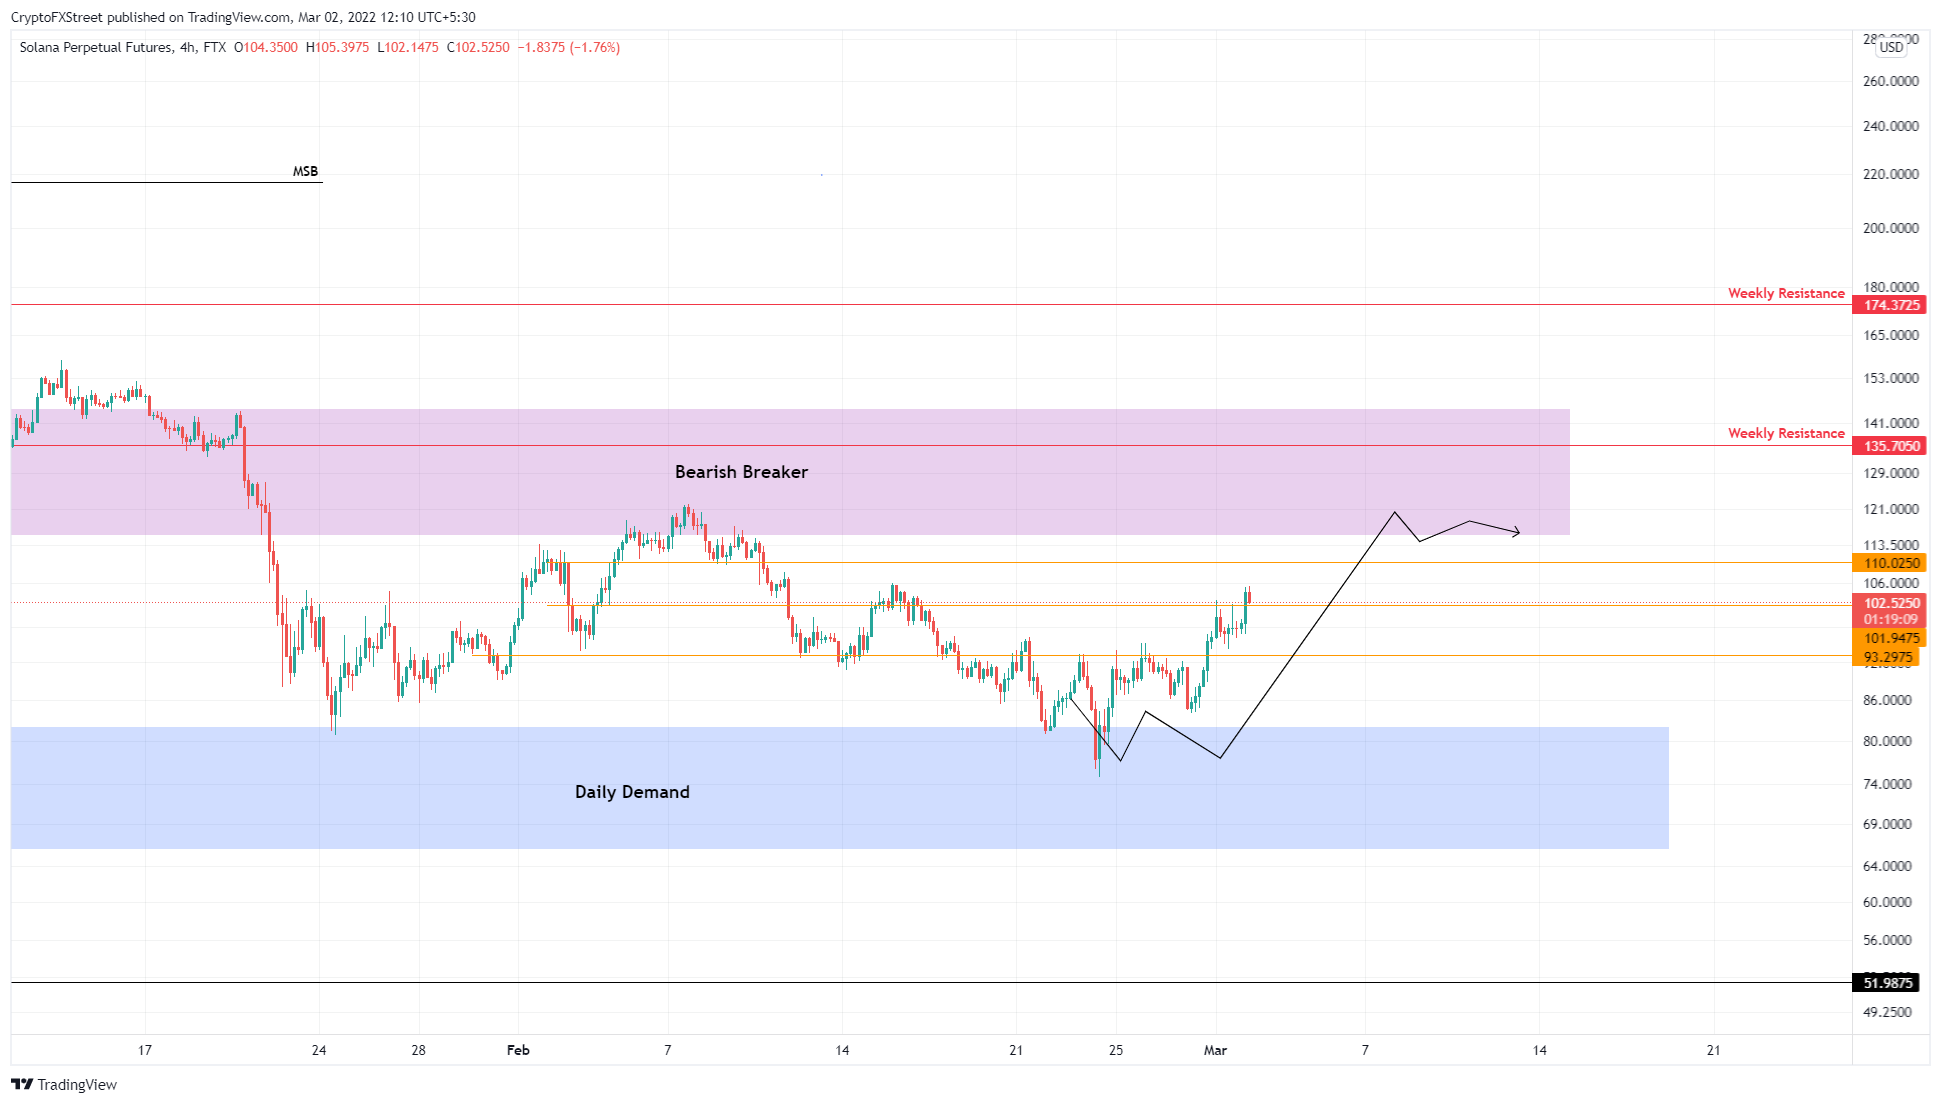
SOL/USDT 4-hour chart
Alternatively, if Solana price shatters through the immediate barriers at $101.94 and $93.29, it will denote a weakening bullish momentum. In such a situation, SOL could revisit the $65.91 to $82.00 demand zone, where buyers could give the uptrend another go.
However, if the selling pressure spike knocks SOL so low it produces a daily candlestick close below $65.91, it will create a lower low and invalidate the bullish thesis. In this case, Solana price might crawl down another level, potentially finding support around $51.98.
Author

Akash Girimath
FXStreet
Akash Girimath is a Mechanical Engineer interested in the chaos of the financial markets. Trying to make sense of this convoluted yet fascinating space, he switched his engineering job to become a crypto reporter and analyst.


