Solana price could follow Terra’s LUNA and plummet 66%
- Solana price reveals a negative diversion between the stock market and cryptocurrencies.
- SOL price is at the cusp of dropping massively as the correlation breaks down.
- Should more dollar strength kick in, expect a nosedive move towards $18.66.

Solana (SOL) price is flashing warning signs and red lights as price action dips back to the low end near $60, flirting with new lows for the year. With price action under downward pressure, the only real level providing any support, for now, is $58.64, which goes back to May 19, 2021, and saw a clear break on August 16. Once bears can break down the wall of support around that level, expect to see a boardroom opening up for bears to move in, with SOL price at risk of dipping below $20.
SOL price at risk of trading below $20
Solana price is cornered as a clear negative diversion materialises this morning during the ASIA PAC session. Where stocks and cryptocurrencies rallied this morning, a dislocation happened overnight at the end of the US session, with stocks rallying to the upside this morning but cryptocurrencies to the downside. Bears have smelled blood and will stick to their position until this triggers panic amongst investors and they sell their stakes.
SOL price is thus feeling the laws of gravity as investors cherry-pick risk assets, and it looks like cryptocurrencies are in the penalty box for now. A proper discount needs to happen before investors come back and are willing to pick up price action again. With a break below $58.84, the next level to watch would be the orange ascending trend line near $40, which could hold some importance, although $18.66 is an important technical pivotal level that will spark a rebound.
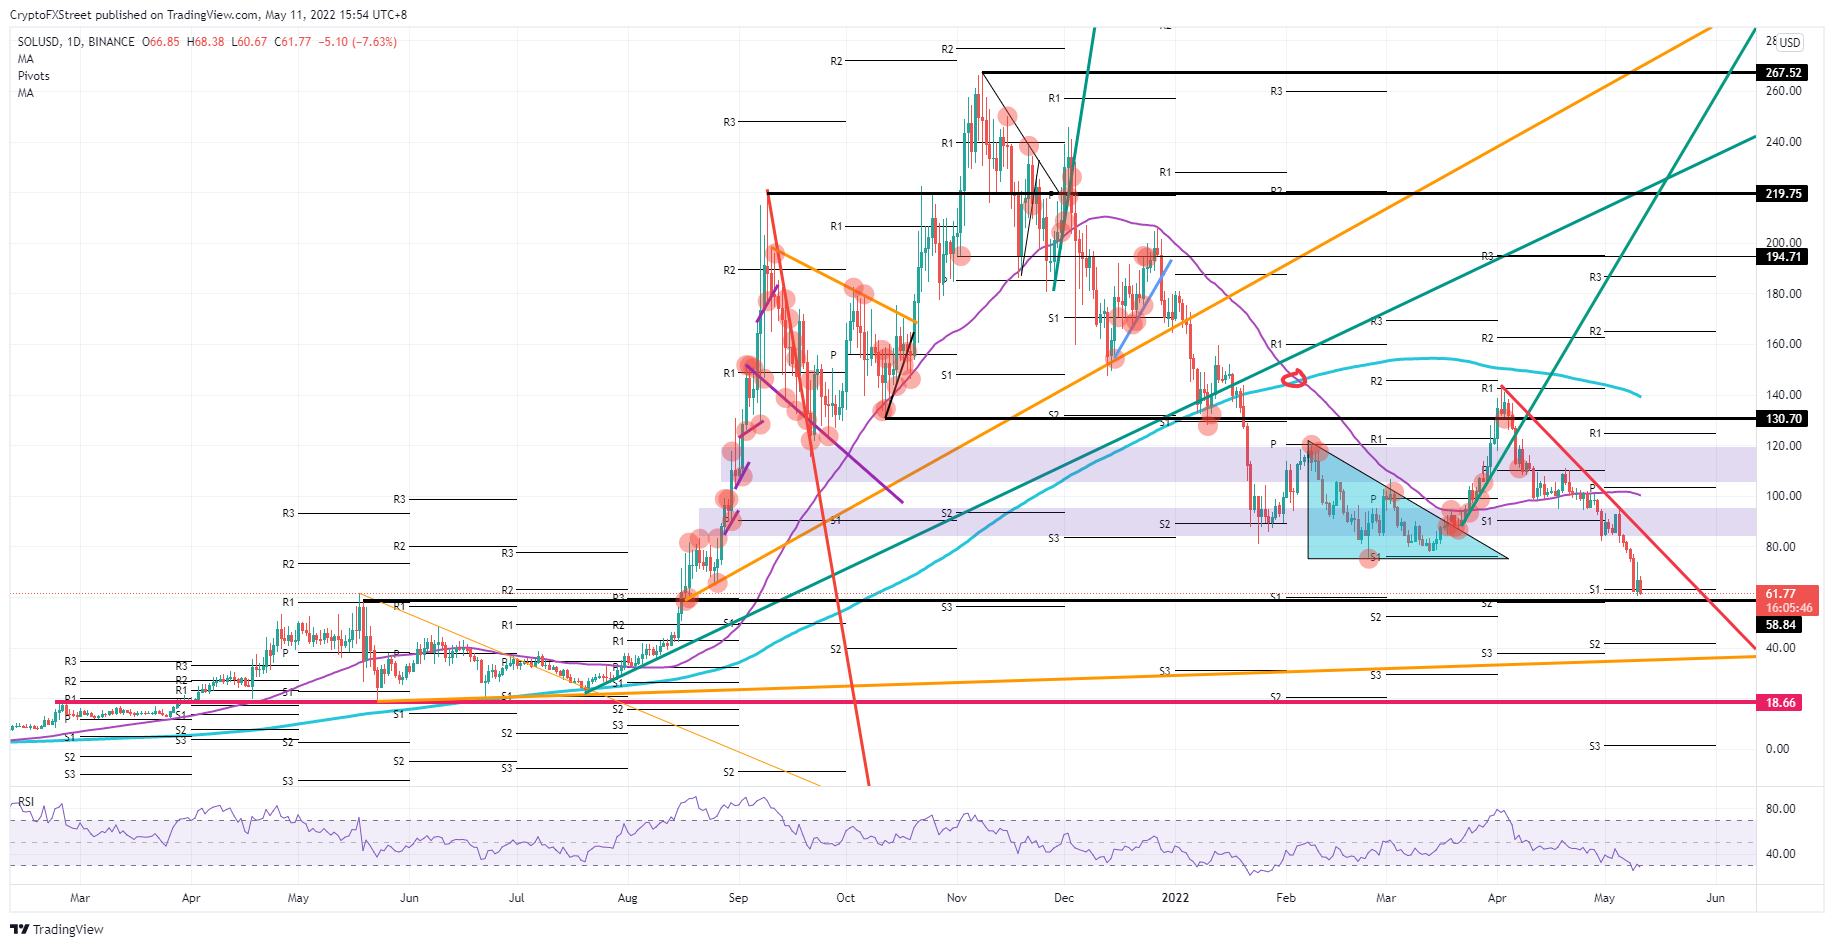
ETH/USD daily chart
The release of US inflation figures today, could spark a domino effect with a small drop is expected, from 8.5% to 8.1%, but an even more significant drop could see investors price out the number of forecasted rate hikes by the FED, and overtly point to less severe monetary tightening, which swings open the door for a rally in risk assets. In financial markets, a single print of economic data could trigger a whole series of events that could spark a turnaround in an asset class. SOL price would see a break above the red descending trend line from April and could be set to test $100 with the 55-day Simple Moving Average and the monthly pivot placing a cap to the upside.
Author

Filip Lagaart
FXStreet
Filip Lagaart is a former sales/trader with over 15 years of financial markets expertise under its belt.



