Can this confluence trigger a 20% recovery rally for Solana price as sellers exhaust
- Solana price hovers around $64 after the recent crash to re-establish the directional bias.
- The support confluence containing a declining support trend line and bullish divergence hints at a 20% recovery rally to $77.
- A failure to close above $66 could trigger a 32% crash to $44.

Solana price has been on a massive downtrend on the high time frame chart. This trend was exacerbated after the Bitcoin price crashed, taking the crypto markets with it. Amid this bearish outlook, SOL shows signs of a potential recovery rally as it tags a significant support confluence.
Solana price at crossroads
Solana price has witnessed three major sell-offs since its all-time high at $261 on November 6, 2021. The first one was on December 3, 2021, when SOL crashed 38% from $239 to $147. Following this was, perhaps, the most brutal crash that pushed the Layer 1 token by 60% from $205 to $80.
The third and most definitely not the last crash was between April 1 and May 10, during which, Solana price nosedived roughly 58% to where it currently stands - $64.
Interestingly, the trend line drawn along the swing lows since September 19 has served as a support level, allowing Solana price a respite amid the crashes. The first bounce pushed SOL to a new all-time high after a 95% rally.
The second and the third bounces were on January 22 and March 14, when Solana price rallied 36% and 84%, respectively. Therefore, the most recent retest could trigger a minor recovery rally for SOL.
Adding credence to this outlook is the divergence between the price’s lower lows since January 22 while the Relative Strength Index (RSI) has formed higher lows. This setup is known as bullish divergence and often resolves in a way that pushes the underlying asset to the upside.
Therefore, investors can expect Solana price to rally at least 20% and retest the $77 hurdle while the sellers are exhausted.
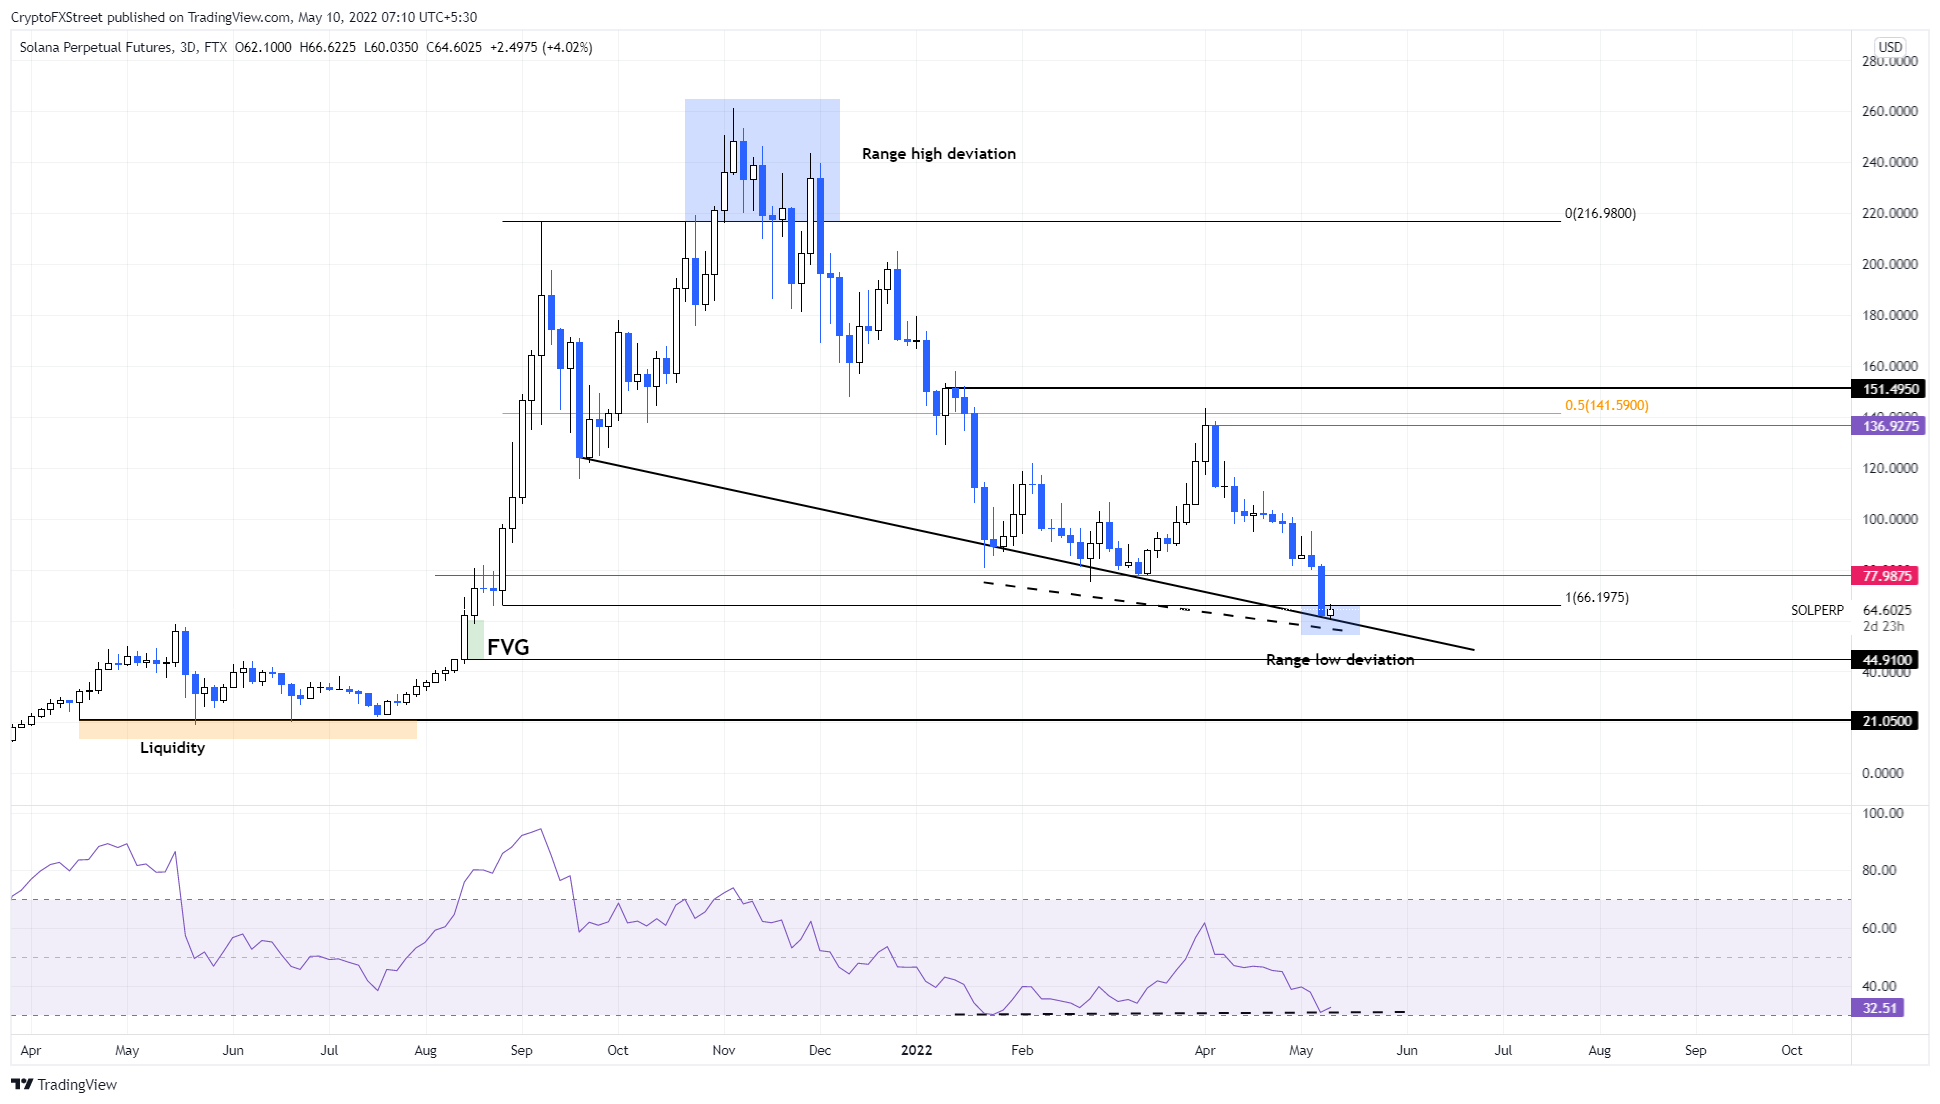
SOL/USDT 3-day chart
While the recovery narrative makes sense from a technical standpoint, investors need to pay attention to the overall trend, which is bearish. Adding more woes to bulls is the fair value gap aka the price inefficiency, extending from $60 to $44.
A failure to quickly recovery above the range low at $66 will indicate weakness among buyers. In such a case Solana price could crash 30% and retest $44.
Author

Akash Girimath
FXStreet
Akash Girimath is a Mechanical Engineer interested in the chaos of the financial markets. Trying to make sense of this convoluted yet fascinating space, he switched his engineering job to become a crypto reporter and analyst.


