Solana price continues to tank despite Instagram NFT support for NFTs
- Solana price continues to slide further south, following the broader cryptocurrency market.
- SOL hits new major swing lows.
- Time cycles may indicate an end to the current downtrend.

Solana price hit new 2022 lows over the weekend, hitting the $75 value area for the first time since late August 2021. However, SOL’s current downswing is likely about to reverse.
Solana price shows bears in control, $50 still in play
Solana price remains in price discovery mode until it hits the next high volume node – which doesn’t appear until the $50 level. An almost total lack of support exists for SOL between the 2022 Volume Point of Control at $90 and the next high volume node (from the 2021 Volume Profile) at $50.
However, the only thing bearish with Solana may be the price action. A strong fundamental development may help return Solana to an uptrend.
Solana NFTs to be supported on Instagram
An extremely bullish fundamental event is Meta’s (formerly Facebook) Instagram integrating NFTs from the Solana ecosystem. Ethereum, Flow, and Polygon NFTs were also confirmed. In a boon for artists in the NFT space, Meta confirmed that there would not be a charge for displaying the digital art.
Validation of ownership of this new asset class on Instagram will be supported through MetaMask, with other wallet support expected to be announced soon.
Time cycles indicate a reversal may begin soon
Solana price shows several changes that point to a probable reversal in price action. The first indication of a trend change is within the Ichimoku Kinko Hyo system: the Kumo Twist.
Kumo Twists are when Senkou Span A crosses Senkou Span B – the Cloud shifts color as well. Kumo Twists can often signal where a new major swing high or low could occur, especially if an instrument has been trending into the Kumo Twist. The Kumo Twist for Solana price is on May 14.
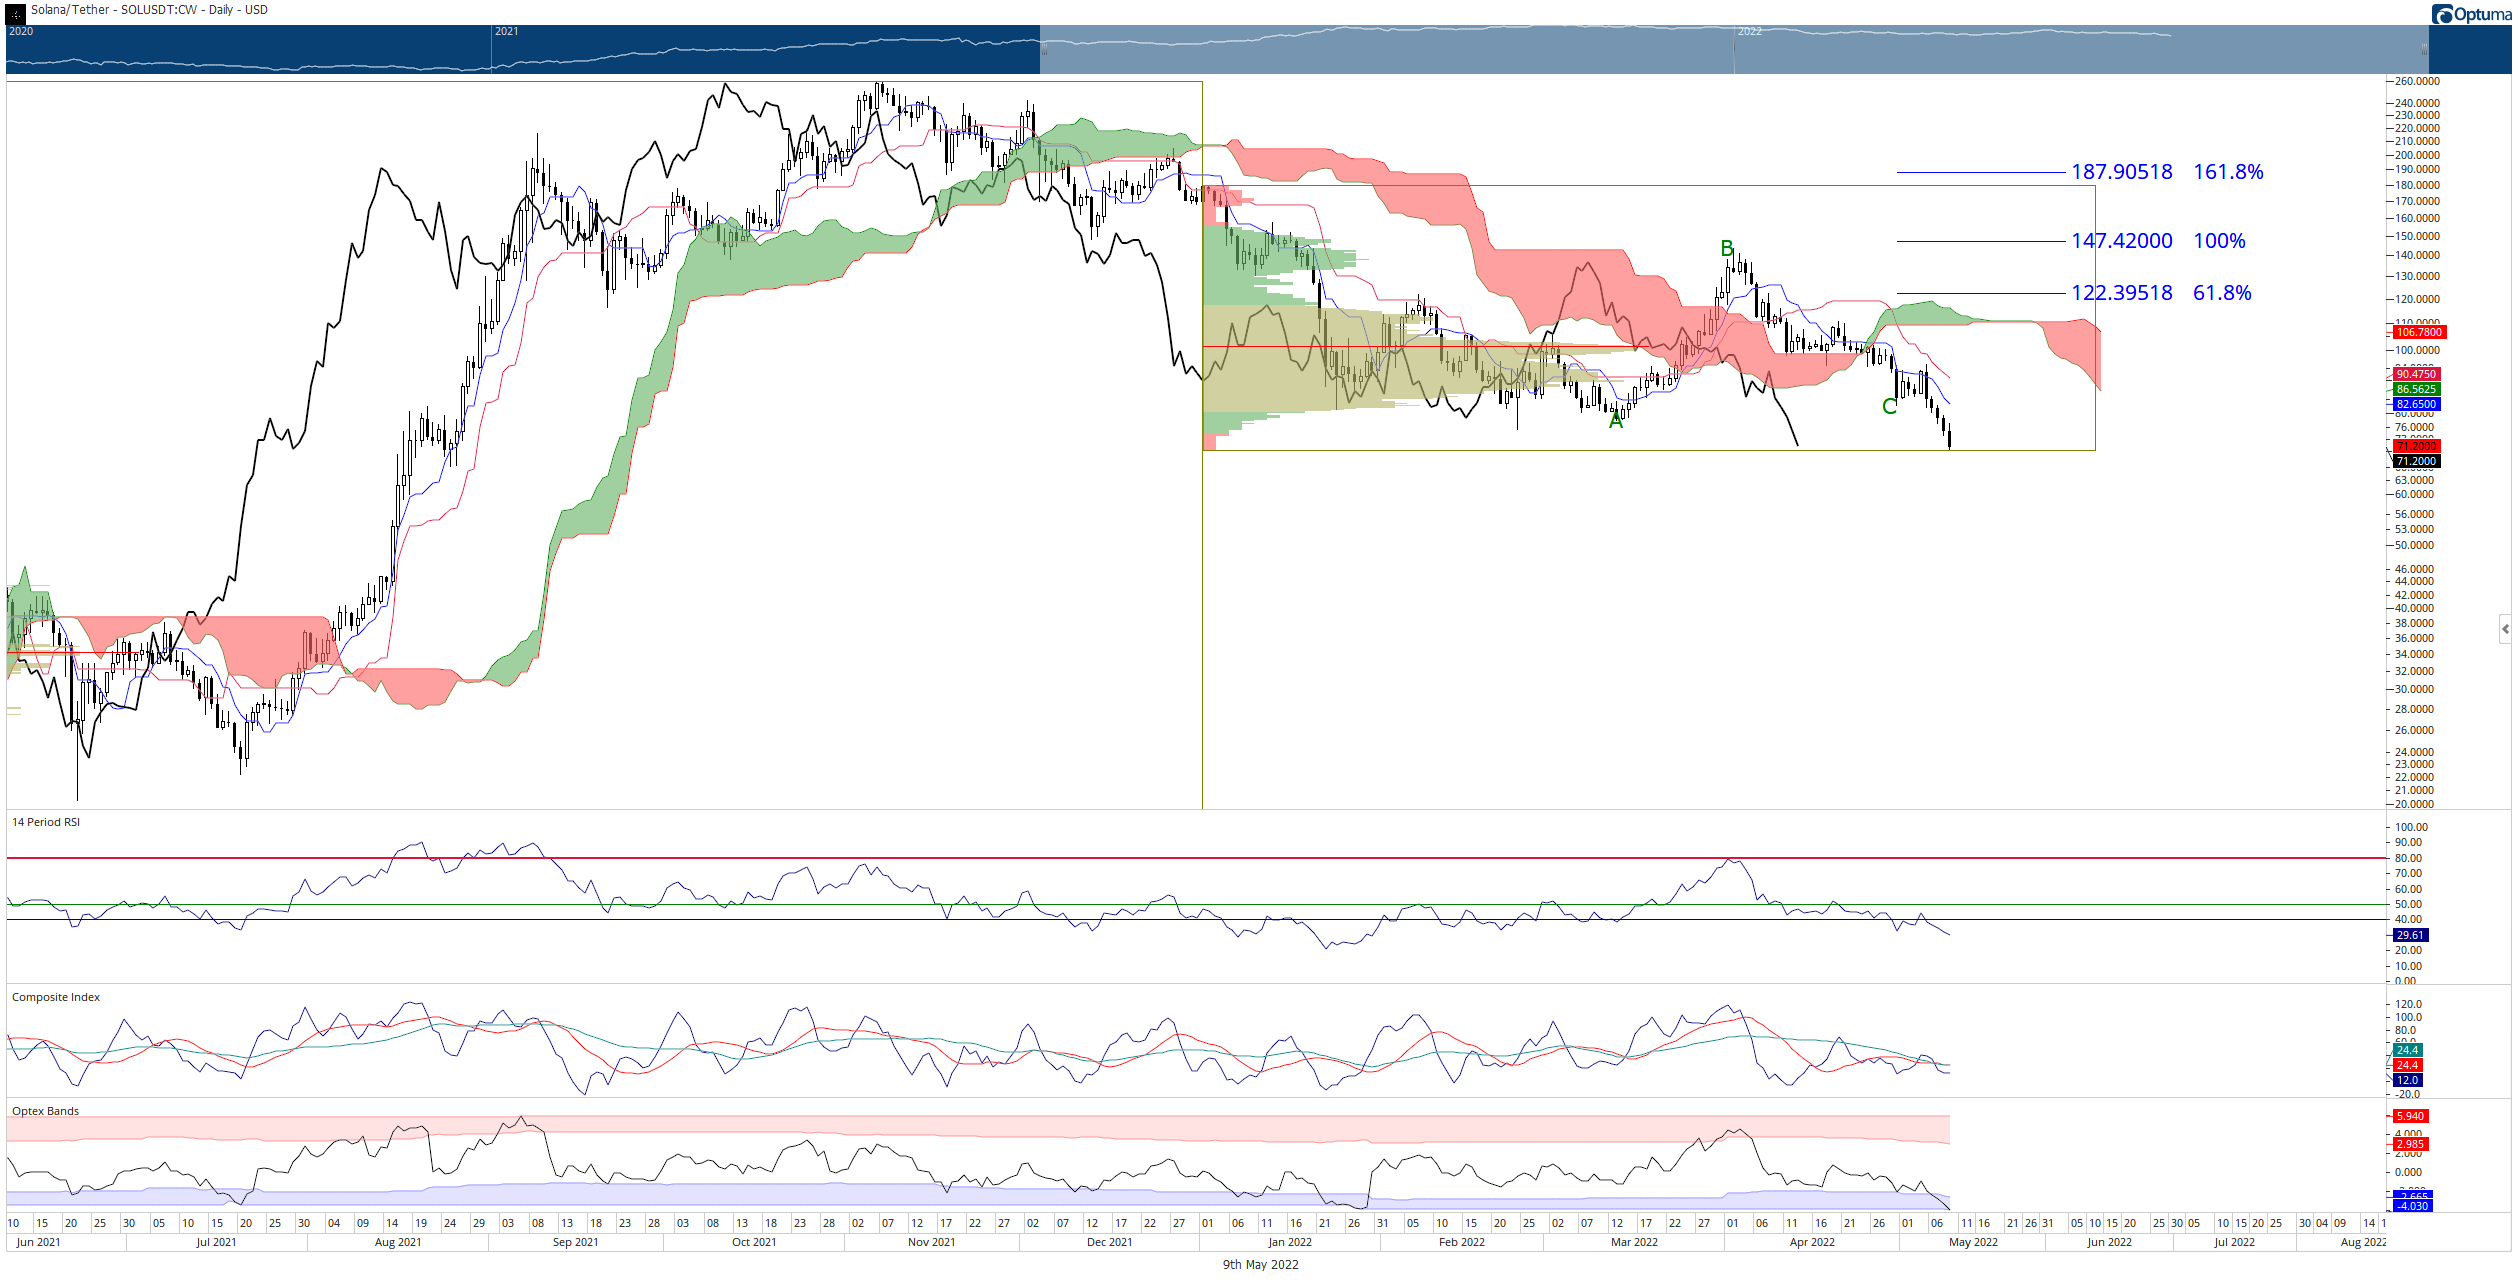
SOL/USDT Daily Ichimoku Kinko Hyo Chart
The second time cycle – and most important – is the 180-day Gann Cycle of the Inner Year. In Gann Analysis, Gann wrote that the 180-day cycle (which can extend to 198 days) would often terminate trends and trigger new trend reversals or strong corrective moves. Solana price is within that 180-day time cycle.
Author

Jonathan Morgan
Independent Analyst
Jonathan has been working as an Independent future, forex, and cryptocurrency trader and analyst for 8 years. He also has been writing for the past 5 years.




