Shiba Inu to revive bullish outlook if SHIB holds above this critical support level
- Shiba Inu price continues to trend lower as it records lower lows, failing to reverse the period of underperformance.
- However, the prevailing chart pattern suggests that SHIB could be preparing for a 42% surge if it tackles the remaining resistances ahead.
- The canine-themed token must hold above $0.00003457 to avoid invalidating the bullish outlook.

Shiba Inu price action has failed to galvanize investors’ enthusiasm as SHIB continues to create lower lows and lower highs. Although the canine-themed token’s momentum has shifted to the downside, the prevailing chart pattern suggests that a slice above $0.00004457 could put a 42% rise on the radar.
Shiba Inu price eyes 42% ascent
Shiba Inu price has formed a falling wedge pattern on the 12-hour chart, suggesting a bullish outlook for the token. The governing technical pattern indicates that SHIB could surge 42% toward the 61.8% Fibonacci retracement level at $0.00006363 if the dog-themed coin slices above the pattern’s topside trend line at $0.00004457.
Before Shiba Inu price could reach the aforementioned optimistic target, SHIB has a few obstacles to tackle ahead. The first area of resistance for the token is at the 21 twelve-hour Simple Moving Average (SMA) at $0.00004337, then at the 100 twelve-hour SMA at $0.00004538, before it confronts the upper boundary of the prevailing chart pattern at $0.00004457.
If Shiba Inu price manages to slice above the aforementioned resistances, additional hurdles may emerge before the token reaches the bullish target. The following obstacles for SHIB are at the 38.2% Fibonacci retracement level at $0.00004819, then at the 50 twelve-hour SMA at $0.00004991, then at the 50% retracement level at $0.00005591.
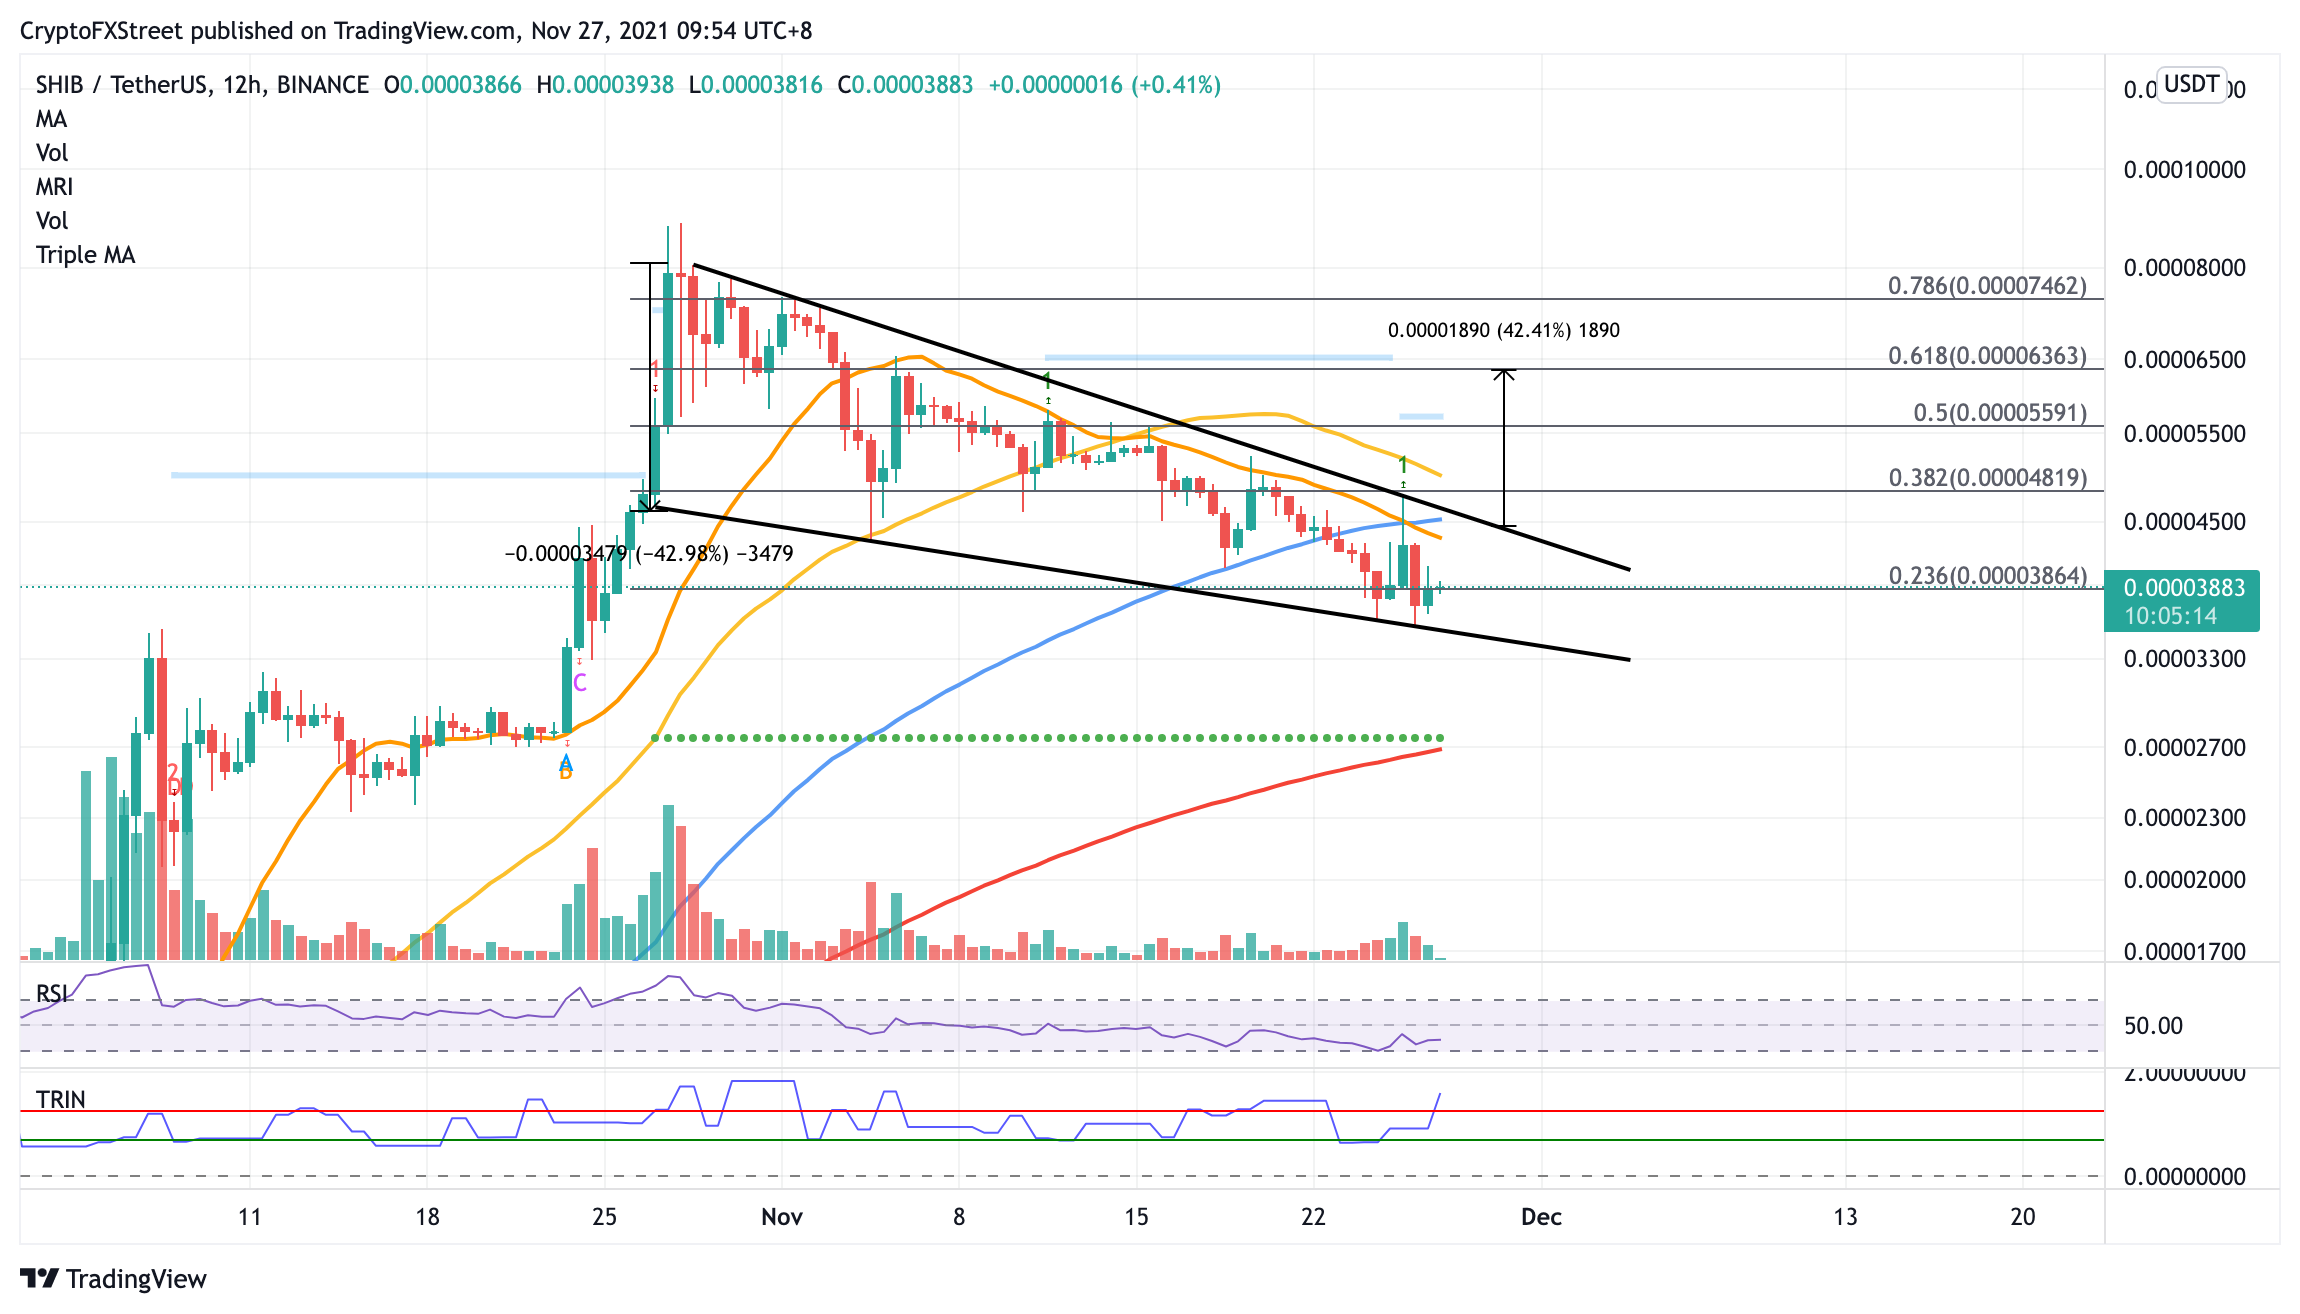
SHIB/USDT 12-hour chart
However, if selling pressure increases, Shiba Inu price could retest critical support levels before restoring its uptrend. The first line of defense for SHIB is at the 23.6% Fibonacci retracement level at $0.00003864. The lower boundary of the falling wedge pattern at $0.00003457 would act as a crucial foothold for the token, as breaking below this level would invalidate the bullish outlook.
If Shiba Inu price witnesses a catastrophic sell-off, SHIB could fall further, reaching the 200 twelve-hour SMA at $0.00002695, which sits near the support line given by the Momentum Reversal Indicator (MRI).
Author

Sarah Tran
Independent Analyst
Sarah has closely followed the growth of blockchain technology and its adoption since 2016.



