Shiba Inu price squeezes, restoring SHIB uptrend towards $0.000088
- Shiba Inu price completed a bearish triangle with a break below $0.00004465.
- SHIB price then saw bulls immediately step in and support price, forming a squeeze.
- Expect a bullish breakout above the red descending trend line, opening up a return towards $0.00005500.
Shiba Inu (SHIB) price has been on a downward trajectory since the end of October. Following the break below the base at $0.00004465, however, bulls quickly began picking up SHIB price and making a fade-in between the low at $0.00004465 and $0.00005000. With bulls sitting on their hands as they bought into Shiba Inu price action, expect an initial phase where bulls ramp-up price action towards $0.00005500, before hitting $0.00008800 in a few weeks time.
Shiba Inu price sees bullish squeeze as bulls buy the dip
Shiba Inu price is receiving support from an intermediary flat trend line that started on the low of November and saw several repeated bounces, each lower than the one before.. As the highs get lower and the lows repeatedly bounced off the same support floor , a squeeze against bears and bulls unfolded. Expect bulls to be victorious in this squeeze as the sell-off in global cryptocurrencies stabilizes, and investors start looking for dips and corrections to buy into.
SHIB price will eventually see a bullish breakout with a quick price pop towards $0.00005500. After the red descending trend line breaks buyers will jump in in increasing numbers., This will then probably be followed by an explosion in SHIB price buy-side demand. That said, price demand will probably then overheat and could even shoot beyond $0.00005500 towards $0.00006889, the 38.2% Fibonacci level.
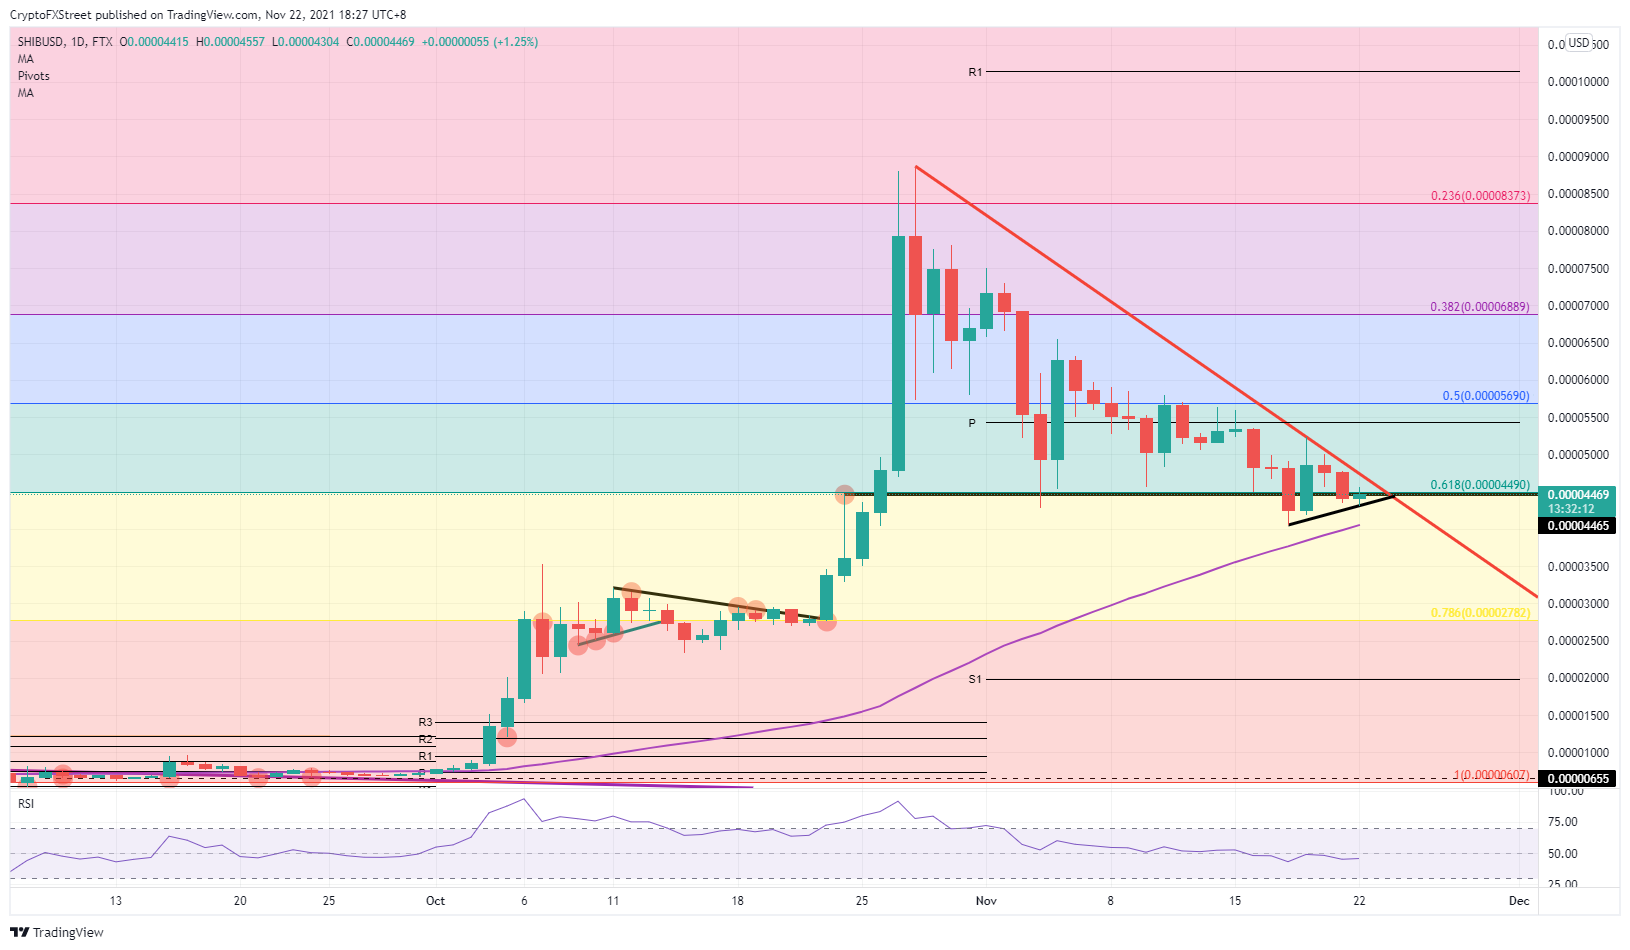
SHIB/USD daily chart
Bulls have got a good battle but it will depend very much on a break of the red descending trend line. If they default on that attempt, expect bears to defend that trend line once again, see a continuation of the downtrend with a break of that intermediary support line, and test the 55-day Simple Moving Average (SMA) around $0.00004000. A push further would see a test back towards the 78.6% Fibonacci level at $0.00002782
Author

Filip Lagaart
FXStreet
Filip Lagaart is a former sales/trader with over 15 years of financial markets expertise under its belt.


