Shiba Inu presents discounted buy opportunity before SHIBA rallies to $0.000085
- Shiba Inu price drops below a double-bottom Point and Figure pattern, but downside pressure subsides.
- The threshold for a bullish breakout has dropped, increasing the odds of a sustained bullish move.
- Downside risks remain but are becoming less likely.

Shiba Inu price action shows evidence that selling pressure may abate and that a new swing low has developed. If this is confirmed, then Shiba Inu is ready to test another breakout above the bear market trendline.
Shiba Inu price sees sellers back off, giving bulls an opportunity
Shiba Inu price continues to face resistance against the bear market trendline (red diagonal trendline). Buyers have made multiple attempts to push Shiba Inu above the bear market trendline, but every attempt has been met with resistance. But a breakout higher may soon occur.
Shiba Inu has a theoretical long opportunity with a buy stop order at $0.0000500, a stop loss @ $0.0000400, and a profit target at $0.00008500. The entry is ideal because, if triggered, two simultaneous events occur—first, the entry would break above the current Volume Point Of Control. And second, the entry fulfills all requirements necessary for a Bullish Shakeout Pattern.
The Bullish Shakeout Pattern is one of the most sought-after reversal patterns in Point and Figure analysis. Generally, this pattern is only valid at the bottom of a swing or trend and near the breakout of a bear market trendline. This pattern often begins new bull markets or resumes previous upswings.
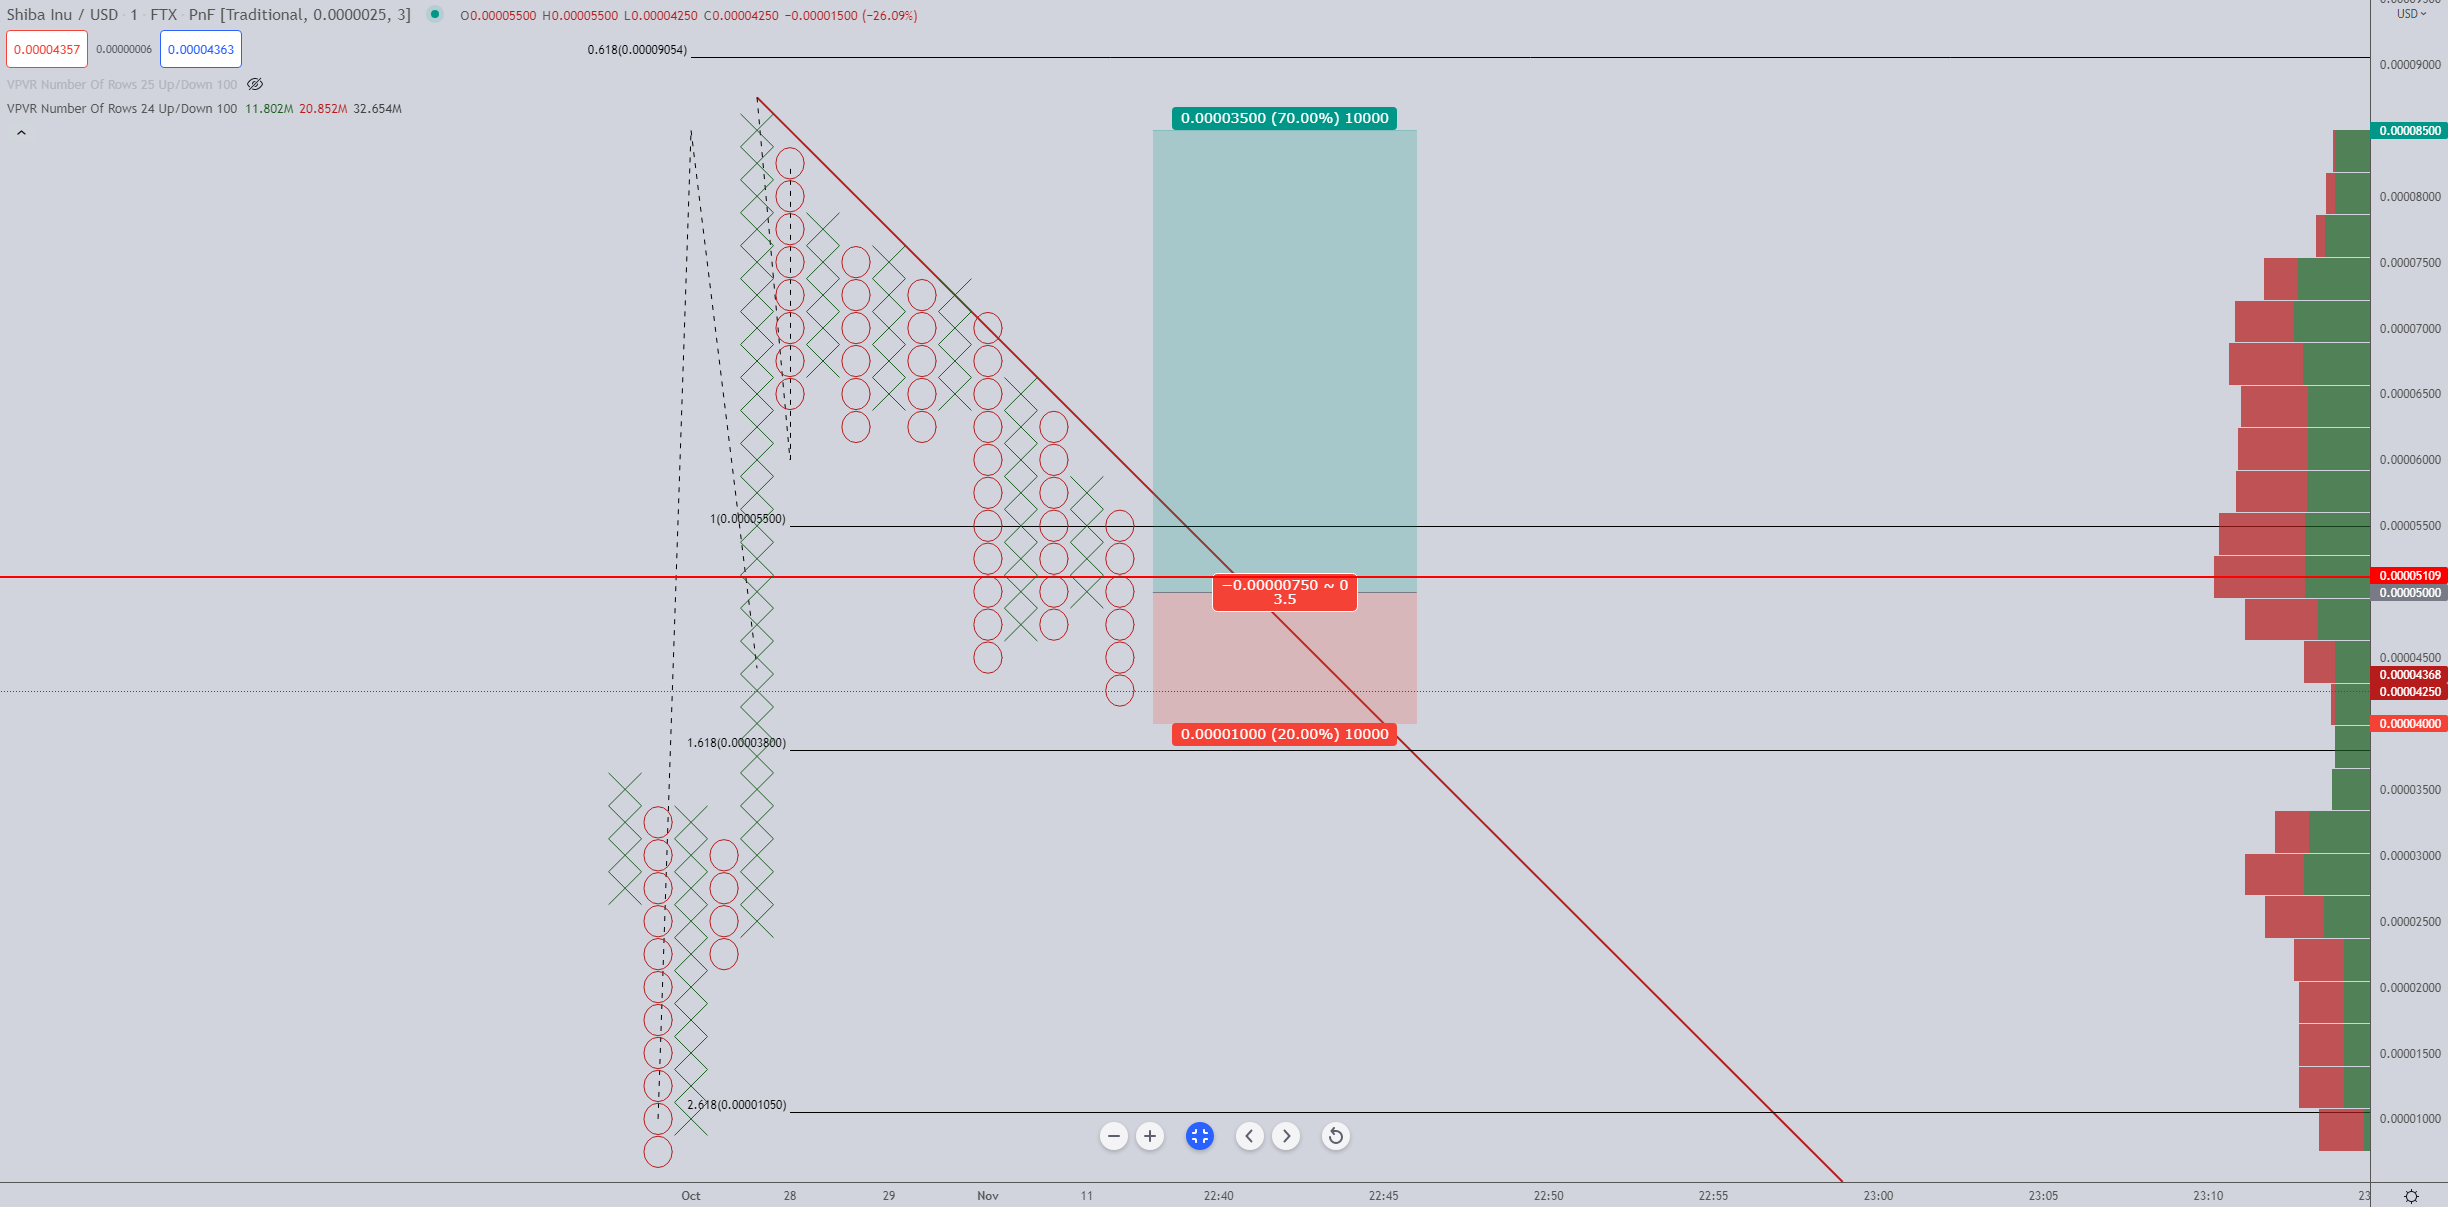
SHIBA/USDT $0.0000025/3-box Reversal Point and Figure Chart
However, bulls will want to check how greedy they become. If Shiba Inu price moved down to $0.0000350, the long entry would be invalidated. Any move below the $0.0000425 could likely trigger a flash-crash towards the $0.0000150 value area.
Author

Jonathan Morgan
Independent Analyst
Jonathan has been working as an Independent future, forex, and cryptocurrency trader and analyst for 8 years. He also has been writing for the past 5 years.



