Shiba Inu restarts bull run as global tailwinds take over
- Shiba Inu has curbed the downtrend with a pickup in buying volume.
- SHIB price looks bullish with a possible return to $0.00004490.
- Expect a possible start of an uptrend towards $0.00008373 if current tailwinds persist.
Shiba Inu (SHIB) price has been under pressure over the weekend and accelerated its downtrend due to the spillover effect from the Bitcoin flash crash. SHIB price then bounced off the monthly S1 support level, however, and created a bullish knee-jerk reaction, reversing most of the incurred losses from the weekend. The short-squeeze could see SHIB price return, first to $0.000004490, and then on the back of a global recovery, perhaps all the way back up to $0.00008373.
SHIB price sees bulls squaring incurred losses
Shiba Inu price sees bulls playing the global recovery story as the bear run was halted at the monthly S1 support level near $0.00003000, and the red descending trend line just below.. Expect bears that came too late to the party to now lick their wounds as the bullish knee-jerk reaction squeezes them out of their positions.. As global equity markets are recovering their losses from last week, more and more bears will be pushed out of their positions, obliged to revert to the buy side and square their losses.
This will result in SHIB price picking up steam to the upside, which will attract more investors to the price action and could easily see bulls reversing the fully incurred losses from past weekend towards the 61.8% Fibonacci level at $0.000004490. Bulls might face some resistance around that level as the 55-day Simple Moving Average (SMA) is hovering just above that 61.8% Fibonacci level. Current tailwinds look quite sound, expect further upside potential towards the 50% Fibonacci level at $0.00005690.
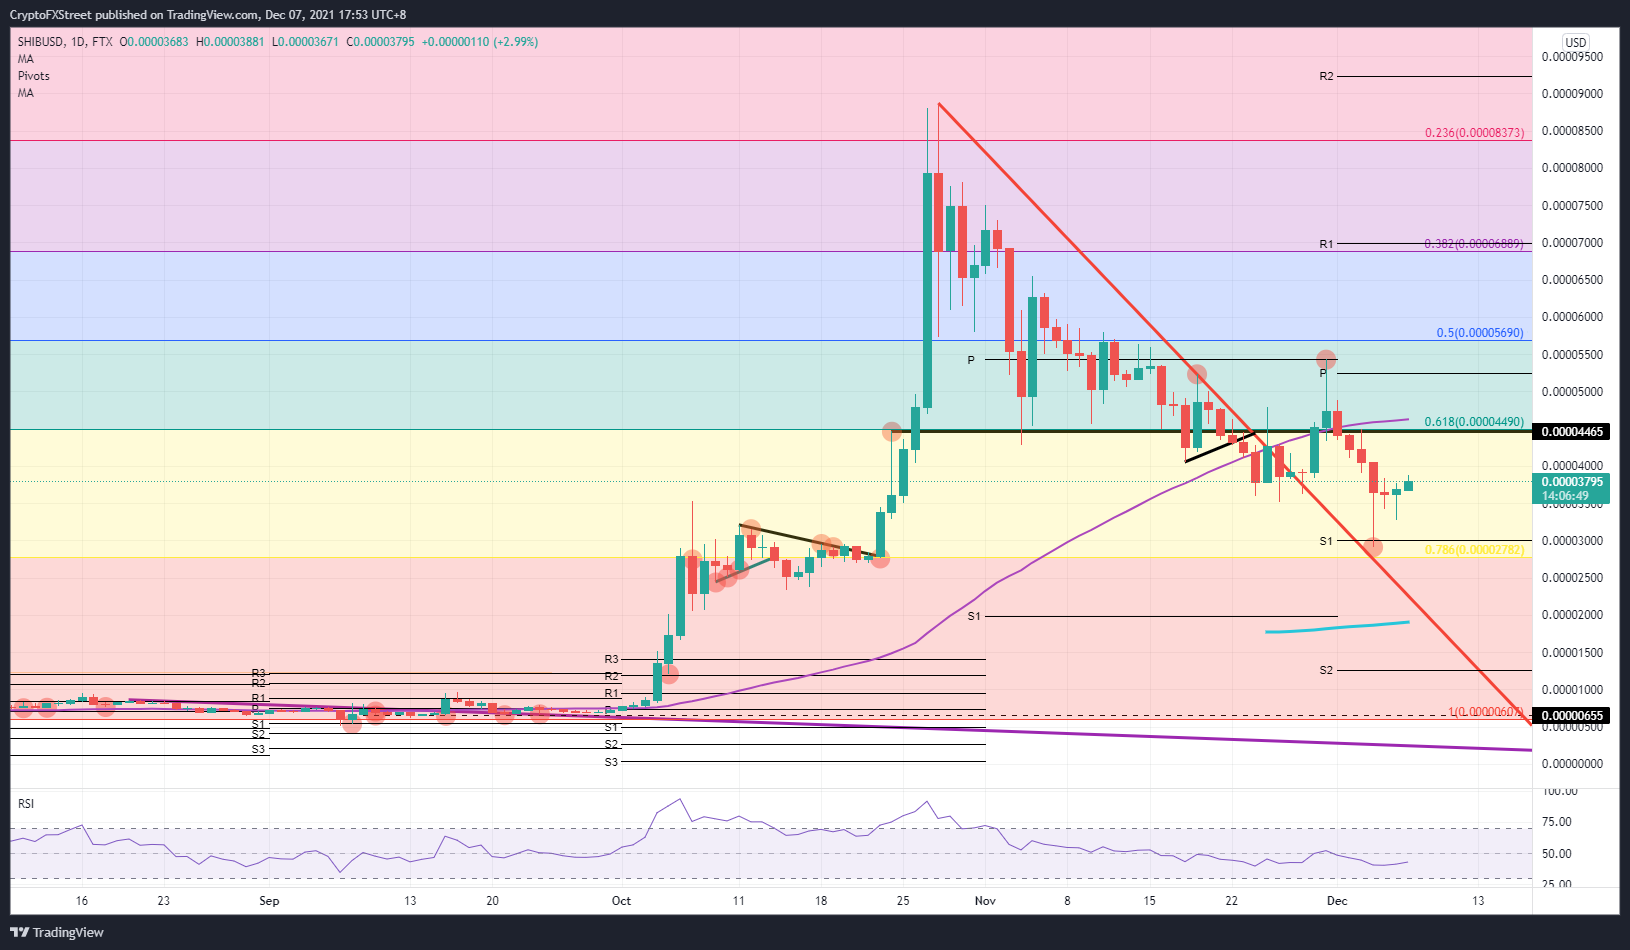
SHIB/USD daily chart
Expect bulls to further add to the rally as more technical levels get cleared, with equity markets pushing to new all-time highs and lifting investment sentiment. By the end of next week, SHIB price could be at $0.00008373, or the 23.6% Fibonacci level. If market sentiment flips back to the downside, expect bears to try and push price action below the red descending trend line with considerable support at $0.00002000 where the 200-day SMA is located.
Author

Filip Lagaart
FXStreet
Filip Lagaart is a former sales/trader with over 15 years of financial markets expertise under its belt.


