Shiba Inu prepares for further losses as SHIB bulls lose control
- Shiba Inu price dropped over 11% since August 24 after slicing below a critical support trend line.
- The governing technical pattern suggests that SHIB is vulnerable to further collapse.
- Only if Shibu Inu manages to sustain above $0.00000759 can it be saved from the prevailing bearish target.

Shiba Inu price has suffered a 22% drop from its swing high on August 17 as it continues to lose momentum. Although the SHIB offered an indecisive outlook with the recent technical pattern emergence, the canine-themed token is headed lower following a break below a key support level.
Shiba Inu price loses momentum
Shiba Inu price presented a symmetrical triangle pattern on the 4-hour chart that confused investors with its directional intentions.
On August 24, SHIB sliced below the base of the technical pattern, making the token vulnerable to a measured move downward of 12%. On the same day, Shiba Inu price also fell below the 100 four-hour Simple Moving Average (SMA), further adding credence to the bearish thesis.
The pessimistic narrative gives Shiba Inu price a downside target at $0.00000714, coinciding with the 61.8% Fibonacci retracement level.
However, before the bearish target materializes, SHIB is also scrambling for support at the 50% Fibonacci retracement level at $0.00000759.
Should Shiba Inu price close below this point, the next line of defense could be unraveled at the 200 four-hour SMA at $0.00000726. Slipping below this level would eventually see SHIB tag the aforementioned target given by the prevailing chart pattern.
If selling pressure continues to increase and the buyers fail to step in at any point, Shiba Inu price may discover further support at $0.00000686 before crashing lower to the 78.6% Fibonacci retracement level at $0.00000651.
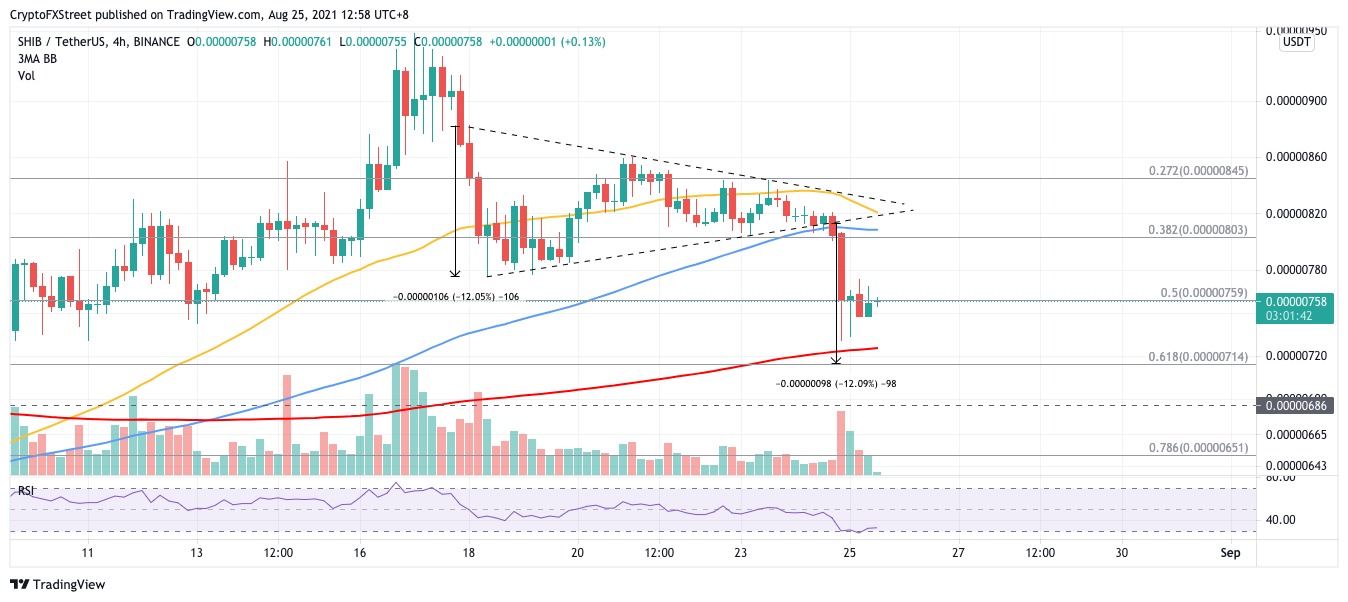
SHIB/USDT 4-hour chart
Should the bulls attempt to reverse the period of underperformance, Shiba Inu price must climb and stay above the 50% Fibonacci retracement level for any hope of a trend reversal.
Bullish investors could aim to tag the 38.2% Fibonacci retracement level at $0.00000803 as the next target before claiming the 100 four-hour SMA at $0.00000809.
Author

Sarah Tran
Independent Analyst
Sarah has closely followed the growth of blockchain technology and its adoption since 2016.



