Shiba Inu price frustrates bullish ambitions, as SHIB allure fades
- Shiba Inu price fails to participate in the crypto complex rally, remaining locked in the handle of the cup-with-handle base.
- SHIB continues to hold the 50-day simple moving average (SMA), thereby not voiding the base breakout.
- Shiba Inu price triggers a bullish Golden Cross pattern on the nine-hour chart, bolstering the layers of support.
Shiba Inu price formed a cup-with-handle base through July and early August before activating on August 16 with a daily close above the handle high of $0.00000887. However, the breakout was met with profit-taking, pushing SHIB back into the handle of the base and raising the possibility of a bull trap. While the breakout has not been voided, the potential for a run to the measured move target of $0.00001214 becomes dimmer with each day.
Shiba Inu price questions base legitimacy
On August 16, Shiba Inu price activated a constructive base after several weeks of indecisive action and complicated price structures. The breakout was met with a -10.75% reversal on August 17, marking the most significant daily decline since June 21. The pullback has put SHIB investors on the defensive with a double-digit loss from the handle high entry price and a possible bull trap.
The Shiba Inu price breakout on August 16 was accompanied by a bullish Golden Cross pattern on the nine-hour chart, indicating a turn in the price structure at a higher timeframe and creating a new source of momentum and support. However, it was overshadowed by a bearish momentum divergence on the nine-hour Relative Strength Index (RSI) and the resulting reversal.
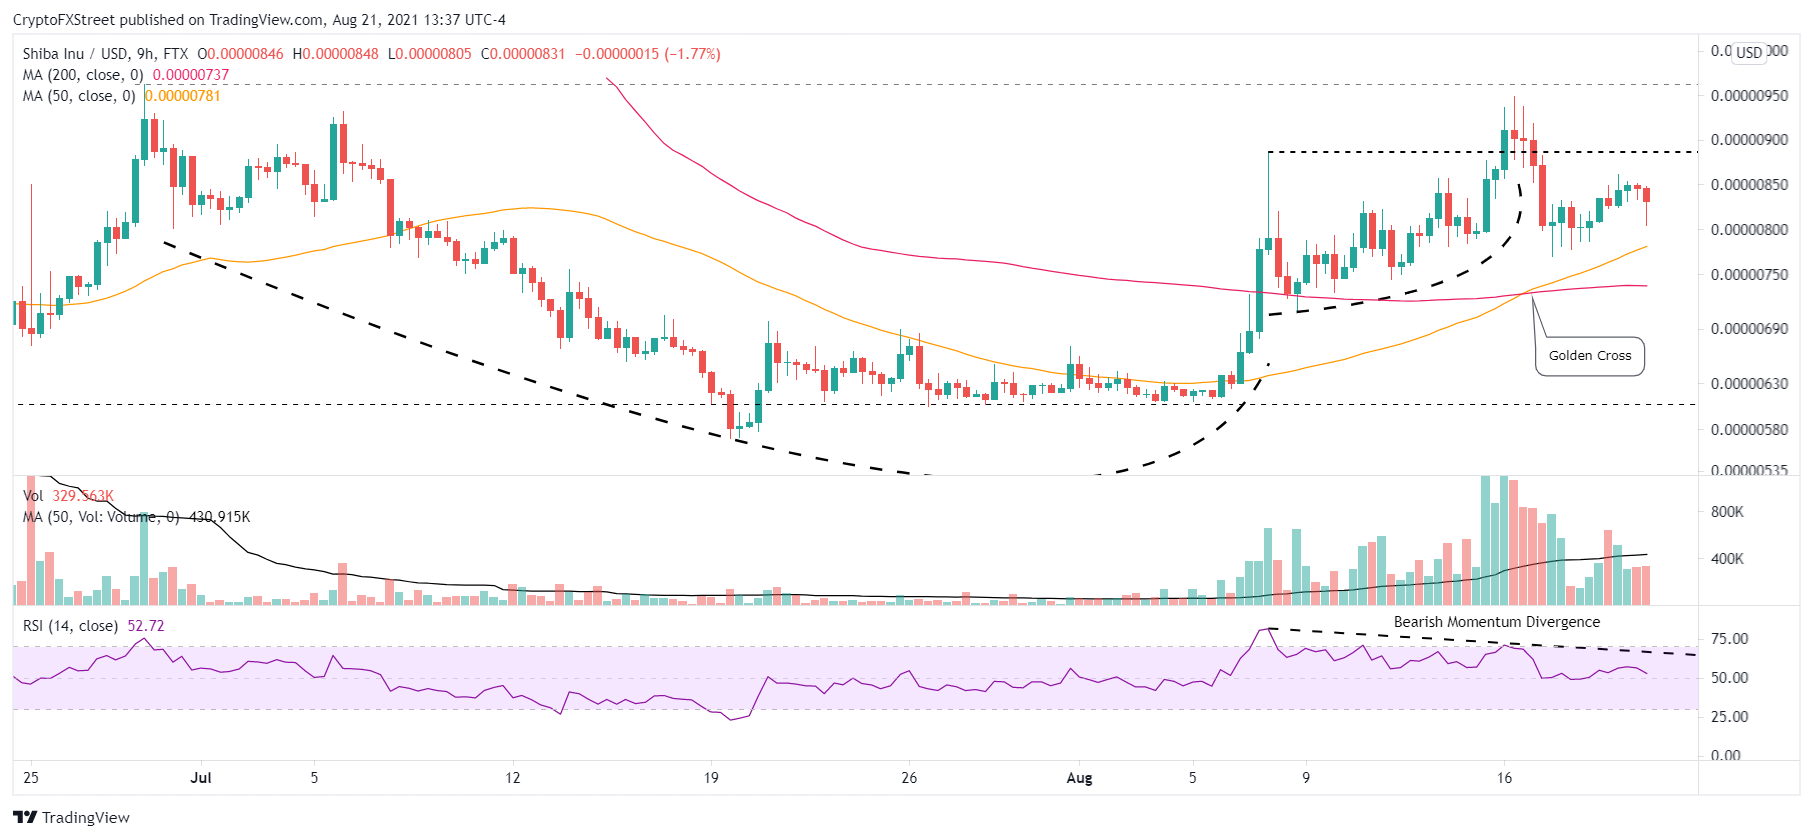
SHIB/USD 9-hour chart
The lack of conviction combined with the bearish momentum divergence and the -10.75% reversal have illuminated the importance of the support outlined by the flattening 50-day SMA at $0.00000728 and the handle low of $0.00000711. A drop below $0.00000711 would be a 14.54% decline from the current price.
A failure to draw support at the union of the two levels on a daily closing basis would instantly turn the Shiba Inu outlook bearish and expose SHIB to an immediate retracement to the governing support created by the May 19 low of $0.00000607. The $0.00000607 level was instrumental in halting the selling pressure during the June and July reversals.
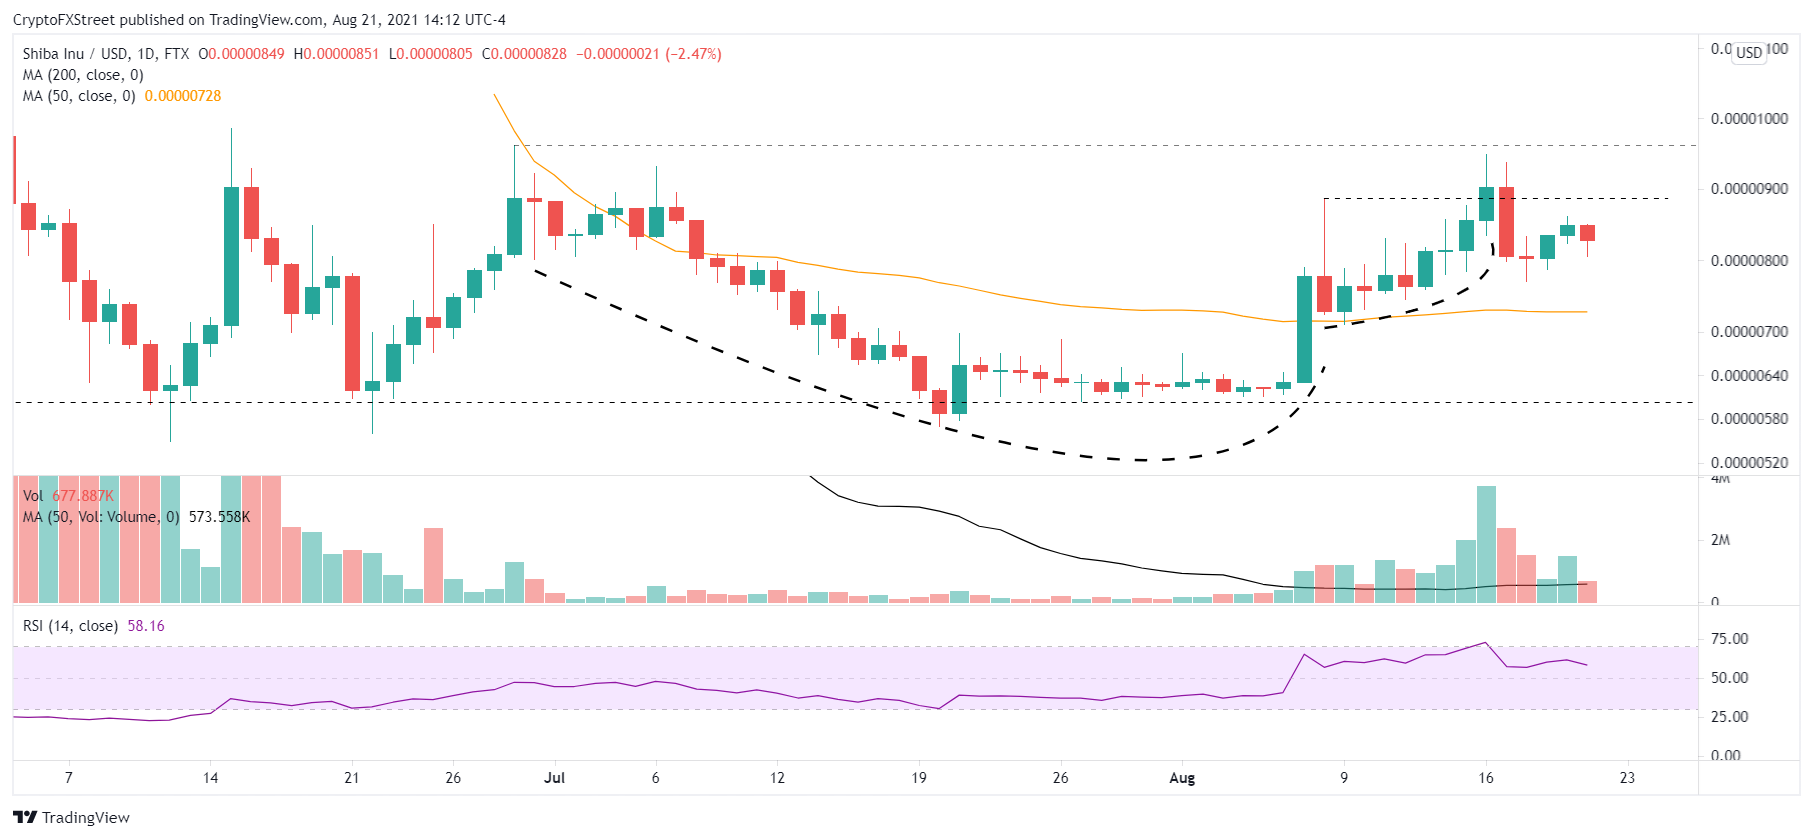
SHIB/USD daily chart
The immediate SHIB pullback on August 17 may have been a reaction to the overbought condition on the daily RSI, but the longer it persists, the greater the challenge to renew the breakout.
To reactivate the cup-with-handle base release, Shiba Inu price needs to log a daily close above the August 16 high of $0.00000949. Otherwise, SHIB speculators will remain locked in a directionless cryptocurrency, further undermining the base authority and the bullish narrative generated by the 23.30% spike from the May 19 low on August 7.
With Bitcoin and several altcoins printing new rally highs, the frustration grows for SHIB investors. It reflects the uneven performance that can occur in the cryptocurrency complex and the enduring challenges implicit in holding outlier cryptocurrencies. Therefore, it complicates the original bullish forecast of a move to $0.00001214 as the meme token loses its allure.
Here, FXStreet's analysts evaluate where SHIB could be heading next as it seems primed for a correction before another run-up.
Author

Sheldon McIntyre, CMT
Independent Analyst
Sheldon has 24 years of investment experience holding various positions in companies based in the United States and Chile. His core competencies include BRIC and G-10 equity markets, swing and position trading and technical analysis.


