• Shiba Inu has hit its topside at $0.0000095 and fallen 16% in value in just two days.
  • Price is consolidating today and looks set to run lower in search of support.
  • There is a silver lining on the horizon with a few supports close to one another.

Shiba Inu has had its run higher but hit a cap at the beginning of the week. A full correction has taken place, wiping out almost the entire profit of two weeks' gains. The velocity at which buyers have been squeezed out of their longs shows that short-sellers were waiting for a moment to strike. The shift in sentiment has taken over control of SHIB price and is pushing price action further down.

Shiba Inu has been tackled in speed by the correction

But there is a silver lining nearby as yesterday Shiba Inu barely touched critical support at $0.0000076. The graph shows price action has hovered above and below that marker with a few retests from time to time on both sides, proving its importance. Price action could still hold above yesterday and today to show that buyers are still keen to step in at decent levels.

Even if that level were to break, SHIB still has a double layer of support below around $0.0000073. Around that level, SHIB has the red descending trend line coming and the 55-day Simple Moving Average (SMA), which act both as support and a good entry point to bounce off. 

The 55-day SMA had shown its importance back on August 8 when prices bounced off that SMA and got a 22% move in just one day. Also, it was the catalyst to have SHIB break the red descending trend line to the upside. 

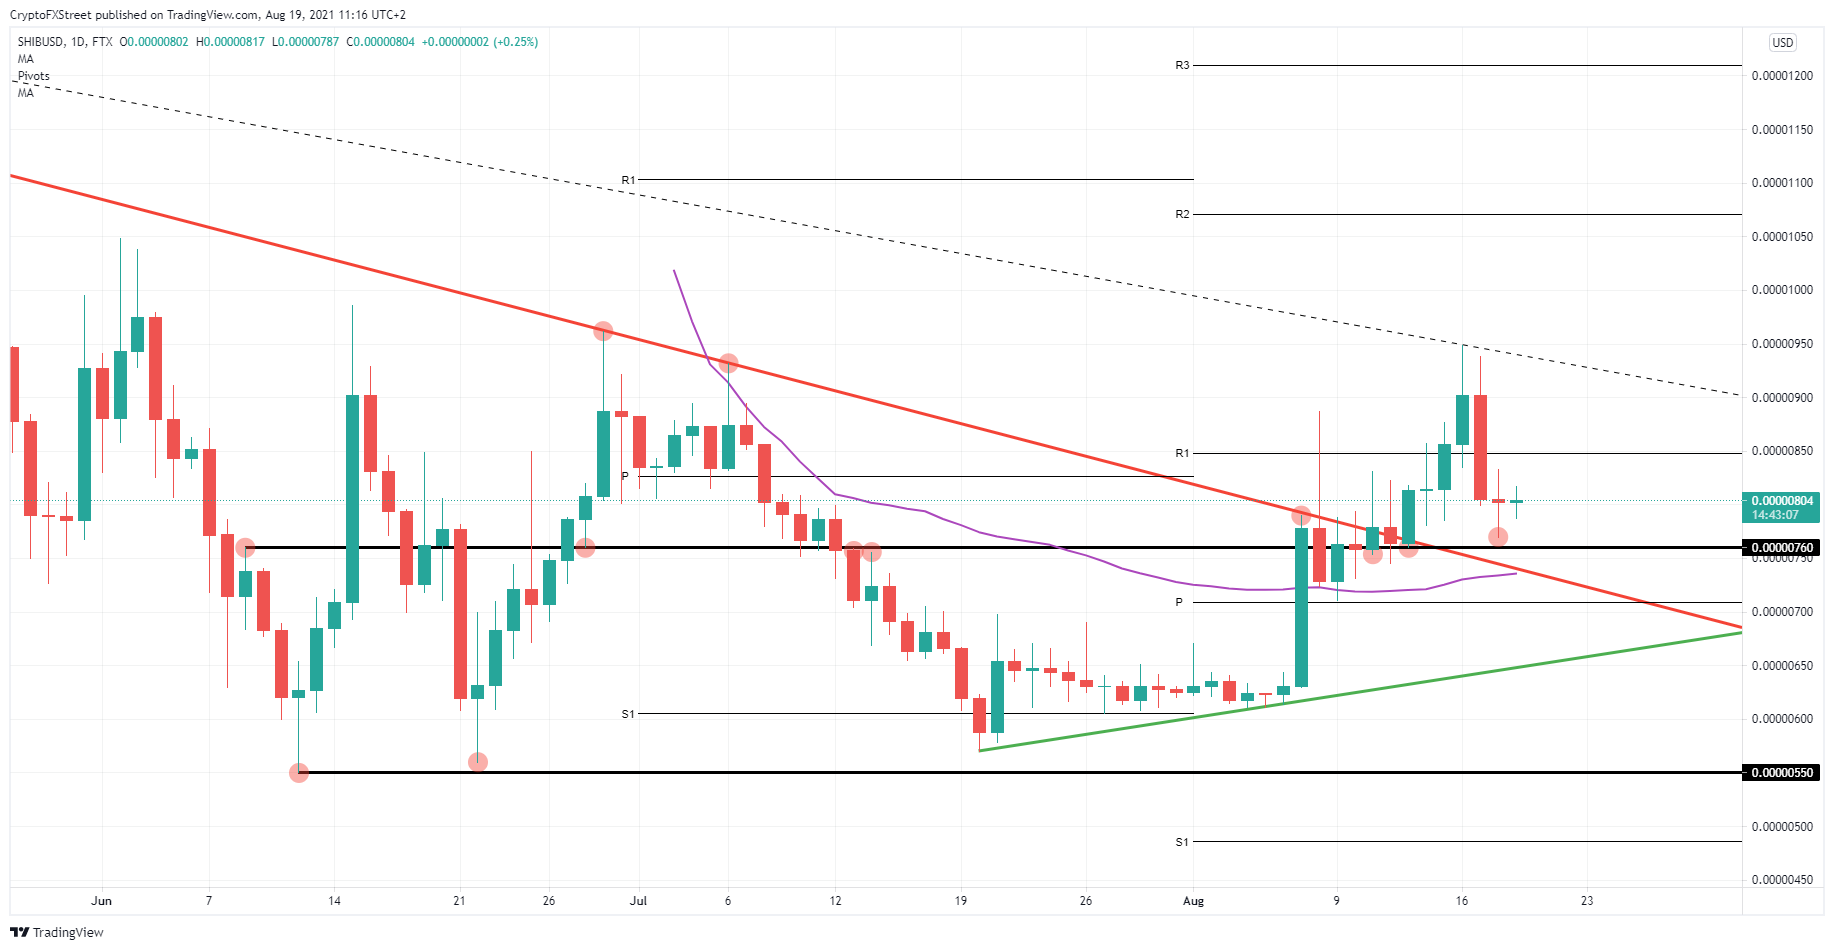
SHIB/USD daily chart

If that does not make the trade, just above at $0.0000070 the monthly pivot also proved its importance on August 09 as SHIB price bounced off there in a premonition of the run higher that concluded a profit of 33%. 

Buyers will be a bit puzzled about the move but expect people to wait out this move and have the dust settled. If there are still enough buyers in SHIB to control price action, expect a run higher again but limited to that dotted descending trend line. $0.0000090 should be a possible price target for the next run higher.


Information on these pages contains forward-looking statements that involve risks and uncertainties. Markets and instruments profiled on this page are for informational purposes only and should not in any way come across as a recommendation to buy or sell in these assets. You should do your own thorough research before making any investment decisions. FXStreet does not in any way guarantee that this information is free from mistakes, errors, or material misstatements. It also does not guarantee that this information is of a timely nature. Investing in Open Markets involves a great deal of risk, including the loss of all or a portion of your investment, as well as emotional distress. All risks, losses and costs associated with investing, including total loss of principal, are your responsibility. The views and opinions expressed in this article are those of the authors and do not necessarily reflect the official policy or position of FXStreet nor its advertisers. The author will not be held responsible for information that is found at the end of links posted on this page.

If not otherwise explicitly mentioned in the body of the article, at the time of writing, the author has no position in any stock mentioned in this article and no business relationship with any company mentioned. The author has not received compensation for writing this article, other than from FXStreet.

FXStreet and the author do not provide personalized recommendations. The author makes no representations as to the accuracy, completeness, or suitability of this information. FXStreet and the author will not be liable for any errors, omissions or any losses, injuries or damages arising from this information and its display or use. Errors and omissions excepted.

The author and FXStreet are not registered investment advisors and nothing in this article is intended to be investment advice.

Recommended content


Recommended Content

Editors’ Picks

Ripple Price Prediction: Whale accumulation sparks hope as rising exchange reserves signal caution

Ripple Price Prediction: Whale accumulation sparks hope as rising exchange reserves signal caution

XRP sustains mid-week recovery as XRP/BTC flashes golden cross for the first time since 2017. Large volume holders increase XRP exposure, indicating rising demand and investor confidence.

Pi Network Price Forecast: PI eyes $0.66 as whale activity surges

Pi Network Price Forecast: PI eyes $0.66 as whale activity surges

Pi Network (PI) declines by nearly 4% on Friday, trading at $0.79 at press time. The technical outlook suggests a downward move ahead as the short-term recovery concludes with a trendline breakdown. 

Bitcoin Weekly Forecast: BTC enters full price-discovery mode after seven straight weeks of gains

Bitcoin Weekly Forecast: BTC enters full price-discovery mode after seven straight weeks of gains

Bitcoin price stabilizes around $111,000 on Friday after reaching a new all-time high of $111,900 this week. Corporate accumulation, institutional demand, signs of easing regulations and fiscal woes in the US have fueled BTC’s rally.

Jupiter Price Forecast: JUP eyes $0.82 as Fluid backs Jupiter's upcoming lending protocol

Jupiter Price Forecast: JUP eyes $0.82 as Fluid backs Jupiter's upcoming lending protocol

Jupiter exchanges announced the upcoming launch of Jupiter Lend, powered by Fluid, on Solana this summer. With the announcement of Jupiter Lend, the JUP token surged 16% in the last 24 hours. 

Bitcoin: BTC enters full price-discovery mode after seven straight weeks of gains

Bitcoin: BTC enters full price-discovery mode after seven straight weeks of gains

Bitcoin (BTC) price stabilizes near $111,000 on Friday after reaching a new all-time high of $111,900 this week. BTC enters an uncharted territory as a perfect storm of corporate accumulation, institutional demand, signs of easing regulation and increasing concerns among investors about debt sustainability in the United States (US) have fueled bullish momentum.

The Best brokers to trade EUR/USD

The Best brokers to trade EUR/USD

SPONSORED Discover the top brokers for trading EUR/USD in 2025. Our list features brokers with competitive spreads, fast execution, and powerful platforms. Whether you're a beginner or an expert, find the right partner to navigate the dynamic Forex market.

BTC

ETH

XRP