Shiba Inu is back on track to pull price action out of the ditch and look for the uptrend
- Shiba Inu price action made a perfect bounce off a supportive pivot.
- SHIB bulls supported price action during the fade on Thursday and are set to break the high of yesterday.
- Expect a further uptick and two small hurdles before a 40% appreciation.
Shiba Inu (SHIB) price saw bulls in contained profit-taking mode as global markets pushed for a down day, on Thursday. This morning, however, bulls have come storming out of the gates and have already pared back Thursday’s losses. Expect a further uptick from here and solid gains going into the weekend, with two hurdles on the way before booking 40% gains by the end of next week.
Once global markets go all-in to risk-on, expect SHIB to spike 40%
Shiba Inu has delivered a bullish signal to investors after yesterday's gloomy downbeat day in global markets, when SHIB price action withstood deepening losses as bears tried to push bulls back against the monthly S1 support level at $0.000025. But bears failed, and bulls limited losses, which were quickly recouped this morning, with SHIB price printing green numbers during the Asian and European session thus far.
SHIB price will have bulls setting their minds on $0.000037 next, with the monthly pivot and the 55-day (Simple Moving Average) as the first trigger for booking some profit along the way. Bulls that enter today can do so at market and park their stops either below the 78.6% Fibonacci level at $0.000028 or below the monthly S1 support level below $0.000025, depending on what type of trader they are, and how big a risk/reward ratio they are comfortable carrying. . In the case of putting the stop below the monthly S1, it makes sense for them to sit on their hands and not close the long trade out at the 55-day SMA and monthly pivot, but keep at least half for the R1 resistance level at $0.000045 that falls in line with the 61.8% Fibonacci level, making it a double level of importance.
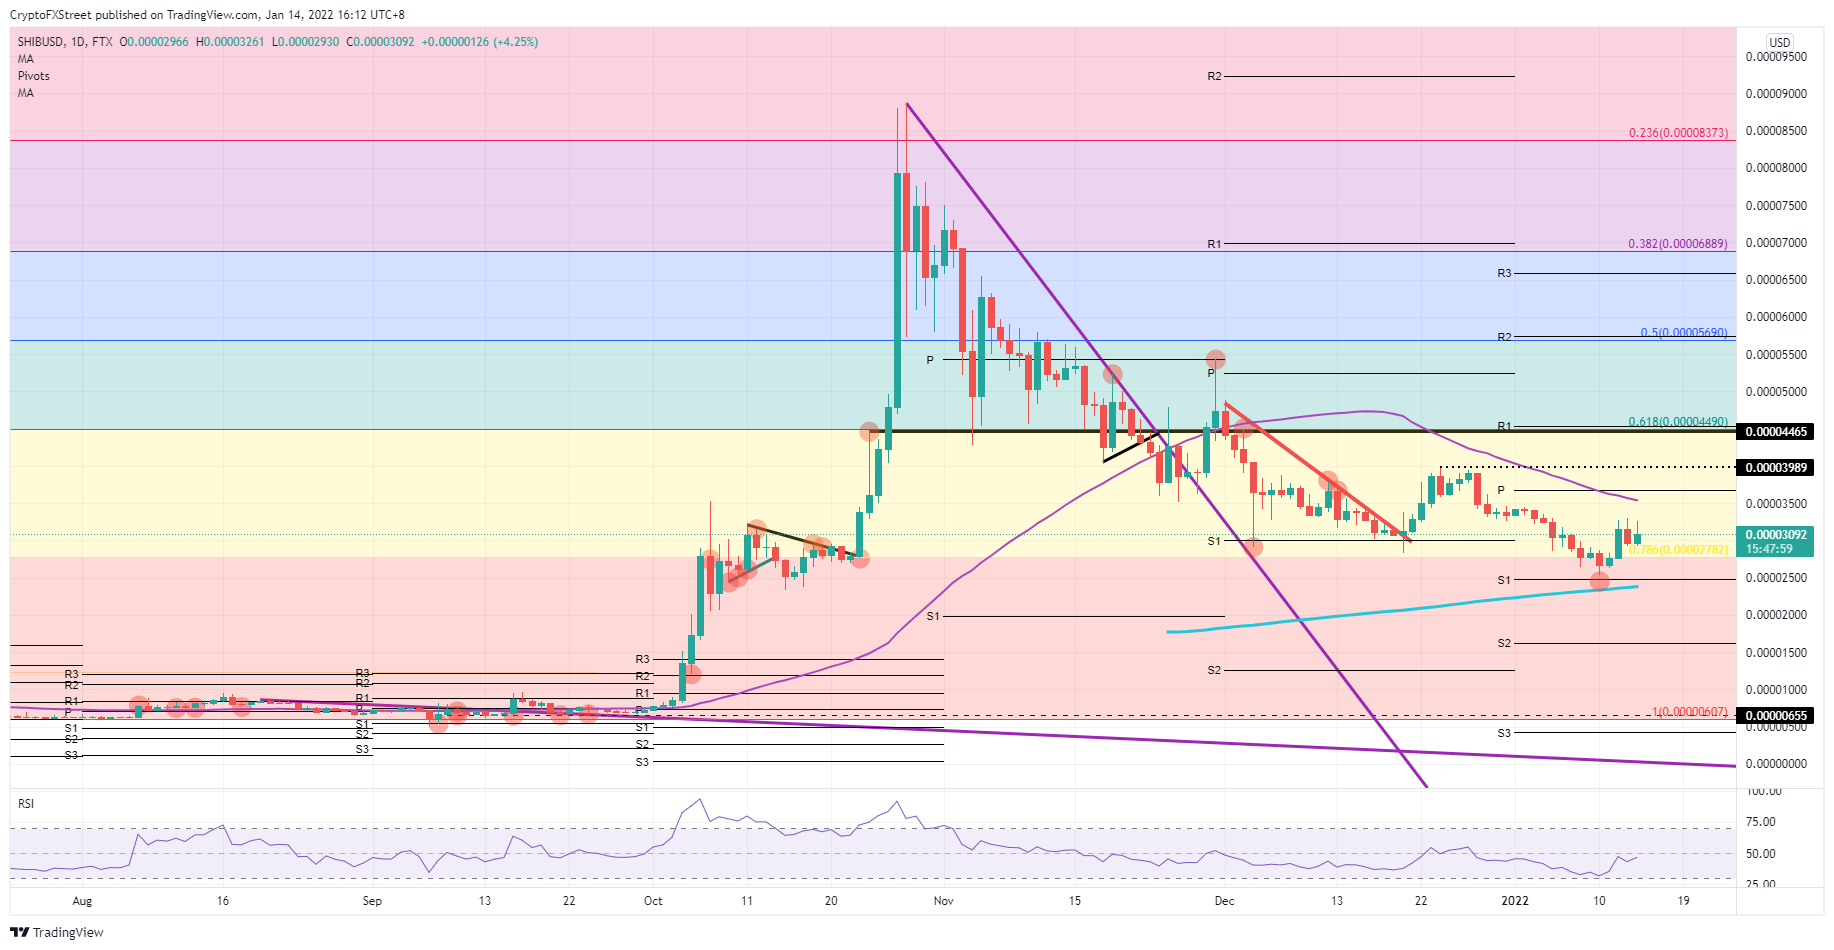
SHIB/USD daily chart
The question at hand is if current global markets can still rally as more and more central banks are tightening. If global markets start to reprice even more to the downside, expect investors to lose faith in the uptrend, and for a quick return towards $0.000025, with S1 and 200-day Simple Moving Average (SMA) as support. If that breaks, a nosedive looks set to begin towards $0.0000061 and the beginning of the Fibonacci retracement.
Author

Filip Lagaart
FXStreet
Filip Lagaart is a former sales/trader with over 15 years of financial markets expertise under its belt.


