Shiba Inu Price Prediction: Bulls positioned to launch SHIB 46% higher
- Shiba Inu price appears ready for a 46% surge as it nears the upper boundary of the governing technical pattern.
- Slicing above $0.00003214 would put the bullish target at $0.00004693 on the radar.
- However, SHIB may face multiple tough obstacles ahead.
Shiba Inu price is preparing for a significant breakout as SHIB approaches a critical level of resistance. If the canine-themed token manages to slice above one crucial hurdle, a 46% ascent toward $0.00004693 is on the radar.
Shiba Inu bulls eye breakout
Shiba Inu price has formed a falling wedge pattern, suggesting a bullish forecast for the token on the 12-hour chart. If SHIB slices above the upper boundary of the prevailing chart pattern at $0.00003214, a 46% climb toward $0.00004693 could be in the offing.
The Momentum Reversal Indicator (MRI) has flashed its second consecutive bottom signal, suggesting that Shiba Inu price is ready for a reversal.
The first obstacle for Shiba Inu price will appear at the 50 twelve-hour Simple Moving Average (SMA) at $0.00003296, then at the resistance line given by the MRI at $0.00003417.
Additional hurdles may emerge at the 100 twelve-hour SMA at $0.00003509 before Shiba Inu price approaches the 38.2% Fibonacci retracement level at $0.00003638. Further selling pressure may propel SHIB toward the 50% retracement level at $0.00003981, coinciding with the 200 twelve-hour SMA.
One last headwind will appear at the 61.8% Fibonacci retracement level at $0.00004324 before Shiba Inu price approaches the optimistic target at $0.00004693.
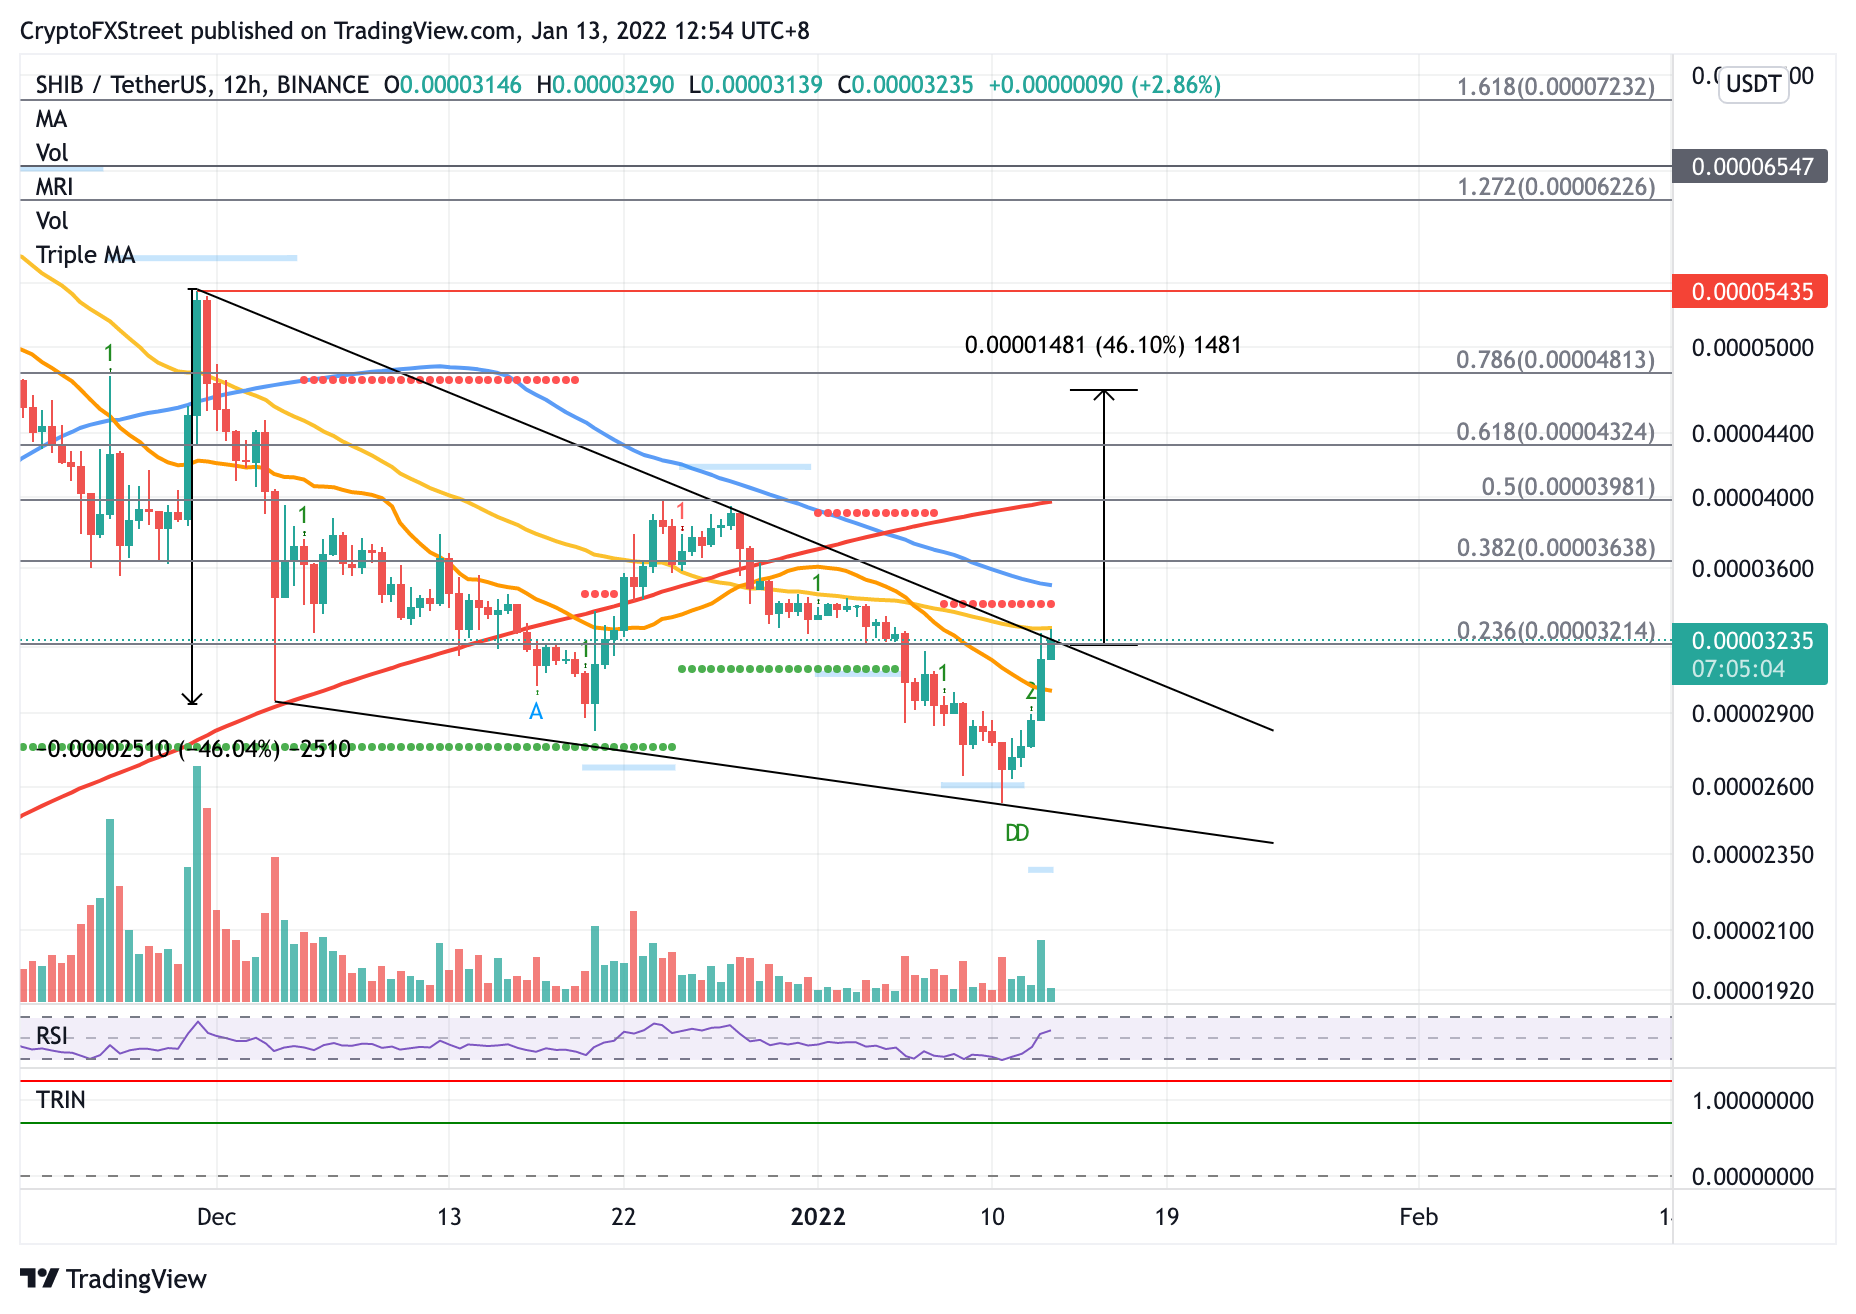
SHIB/USDT 12-hour chart
Bigger aspirations paired with a spike in buy orders may incentivize the bulls to target the 78.6% Fibonacci retracement level at $0.00004813.
However, if selling pressure rises, Shiba Inu price may slide lower within the prevailing chart pattern to tag the nearest support level at the 21 twelve-hour SMA at $0.00002993. Additional footholds may emerge at the December 4 low at $0.00002944, then at the January 5 low at $0.00002848.
Author

Sarah Tran
Independent Analyst
Sarah has closely followed the growth of blockchain technology and its adoption since 2016.


