SafeMoon Price Forecast: SAFEMOON probabilities align in favor of a 30% rally
- SafeMoon price orchestrating an inverse head-and-shoulders pattern on the four-hour chart.
- 50 four-hour simple moving average (SMA) has turned upwards for the first time since May 16.
- May 11 declining trend line to offer resistance if SAFEMOON gains price traction.

SafeMoon price evolution over the past ten days has tested the patience of bullish SAFEMOON investors. The transition of the 50 four-hour SMA does establish a new level of support if the rookie digital asset commands some buying pressure. The upside is likely limited over the next few hours as SafeMoon price completes the right shoulder of the pattern. Still, probabilities are becoming stacked in favor of a bullish resolution.
SafeMoon price continues consolidation, looking more like other cryptos
SAFEMOON was launched on March 21 with a SafeMoon price of $.0000000010, and it reached $0.00001500 on April 20, rewarding the first adopters with an astronomical return. The magnitude and speed of the advance captured headlines, lifting the number of users to over one million.
The market capitalization has been in a range of $3 billion to almost $4 billion, ranking it around #200 in the cryptocurrency rankings. It is relatively inexpensive compared to most digital assets allowing investors to amass positions in the millions of SAFEMOON.
The latest tally shows around 600 trillion SAFEMOON tokens in circulation, but developers can burn tokens manually with the logic that a smaller supply will drive down price. In the protocol whitepaper, SAFEMOON state that it “aims to implement a burn strategy that is beneficial and rewarding for those engaged for the long term.”
SAFEMOON is not listed on the major cryptocurrency exchanges, so enthusiastic investors need to access it on the decentralized PancakeSwap exchange.
Currently, SafeMoon price attempts to replace the larger downtrend that began on May 11 with a firm bottom. The inverse head-and-shoulders pattern on the four-hour chart presents a high probability entry point for investors to initiate pilot buys with precise risk levels.
The right shoulder forms along the rising 50 four-hour SMA at $0.00000483, with the neckline at $0.00000495. Volume has declined throughout the pattern development, highlighting most of the selling pressure has exited.
The measured move target is $0.00000643, earning a 30% gain from the current position of the neckline. The target is slightly above the 38.2% Fibonacci retracement of the May decline at $0.00000620 and intersects with May’s declining trend line, establishing firm resistance.
A push above the declining trend line will quickly discover resistance at the 200 four-hour SMA at $0.00000671. Additional upside targets include the 50% retracement at $0.00000731 and the 61.8% retracement at $0.00000841
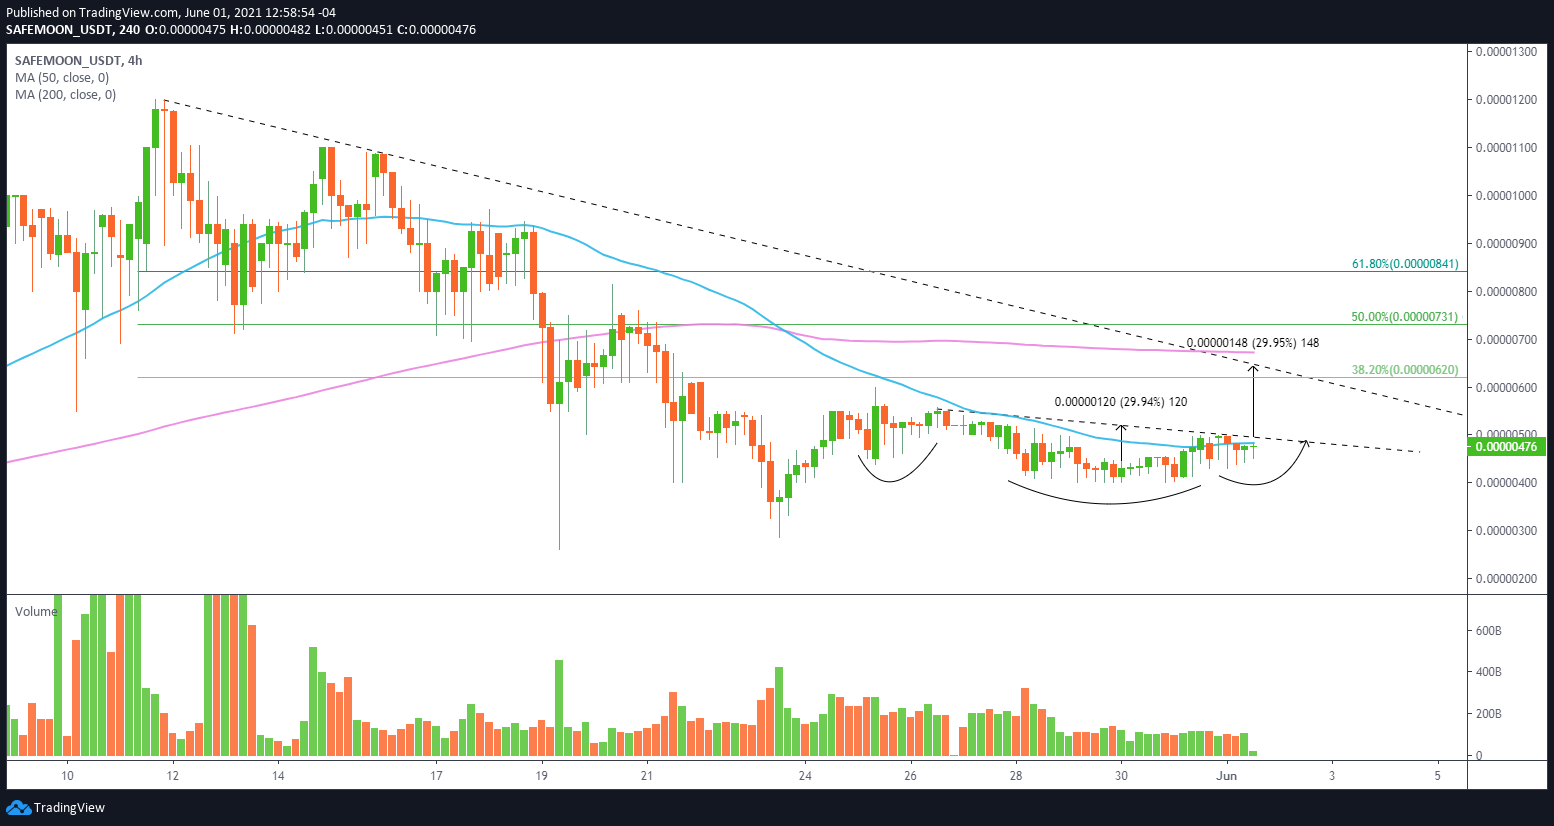
SAFEMOON/USD 4-hour chart
After tagging the all-time high at $0.00001500 on April 20, SafeMoon price collapsed 90% as FOMO exited the building. Based on that experience, investors need to be prepared for the downside.
A four-hour close below $0.00000400 would void the inverse head-and-shoulders pattern and leave SafeMoon price exposed to a test of the June 23 low at $0.00000285 and then the May 19 low at $0.00000261, yielding a 45% decline.
For now, SafeMoon price is defining a price history and personality, searching for the next wave of brave investors and media hype to transform it into a mainstay digital asset.
Author

Sheldon McIntyre, CMT
Independent Analyst
Sheldon has 24 years of investment experience holding various positions in companies based in the United States and Chile. His core competencies include BRIC and G-10 equity markets, swing and position trading and technical analysis.


