SafeMoon Price Analysis: SAFEMOON vulnerable to a 65% decline
- SafeMoon price emergence from an inverse head-and-shoulders formation failed yesterday on the four-hour chart.
- Declining 50 and 200 four-hour simple moving averages (SMA) putting heavy pressure on SAFEMOON since May 23.
- A close above the tactically important 50 four-hour SMA may prevent the digital token from collapsing to the May 19 low.

SafeMoon price failed to build on the breakout from an inverse head-and-shoulders formation on May 25, leaving SAFEMOON exposed to fall below the right shoulder, thereby voiding the bullish outlook for the new cryptocurrency.
SafeMoon price unable to find a new source for astronomical returns
SAFEMOON is not a household name in the cryptocurrency complex. Still, since its launch in March it has commanded considerable attention from keen market operators as the next iconic altcoin. Currently, SafeMoon price trades at fractions of a cent, meaning that investors can amass a position of millions of SAFEMOON.
SAFEMOON is not listed on the major cryptocurrency markets, so most interested investors can access it on the decentralized PancakeSwap exchange. The latest tally shows there are now 600 trillion SAFEMOON tokens in circulation. Still, developers continue to burn tokens manually with the logic that a smaller supply should drive the price higher.
From the launch in March until the April 20 high, SafeMoon price climbed an astounding 20,000%, peaking at around $0.000015. Due to the rise, investors were immediately attracted to the highly speculative cryptocurrency, but by April 21, FOMO had exited the building, and SAFEMOON collapsed 90%.
SafeMoon price is locked in a larger downtrend that began on May 11 and is marked by intermittent corrective bounces. The recent inverse head-and-shoulders pattern presented a higher probability opportunity for investors to begin pilot buys with precise risk levels. Yesterday, the subtle opportunity was rejected when SAFEMOON traded below the right shoulder at $0.00000438.
The rejection has quickly shifted the outlook from positive to negative. There is no credible support at the time of writing until the May 23 low at $0.00000285, followed closely by the May 19 low at $0.00000261, yielding a 35% decline. The tight SafeMoon price range framed by the two lows should instigate some buying interest from the ‘buy-the-dip’ investors.
A four-hour close below $0.00000261 would accelerate the selling pressure, knocking SafeMoon price down to the April 21 low at $0.00000150, or even further, erasing almost 65% from the price at the time of writing.
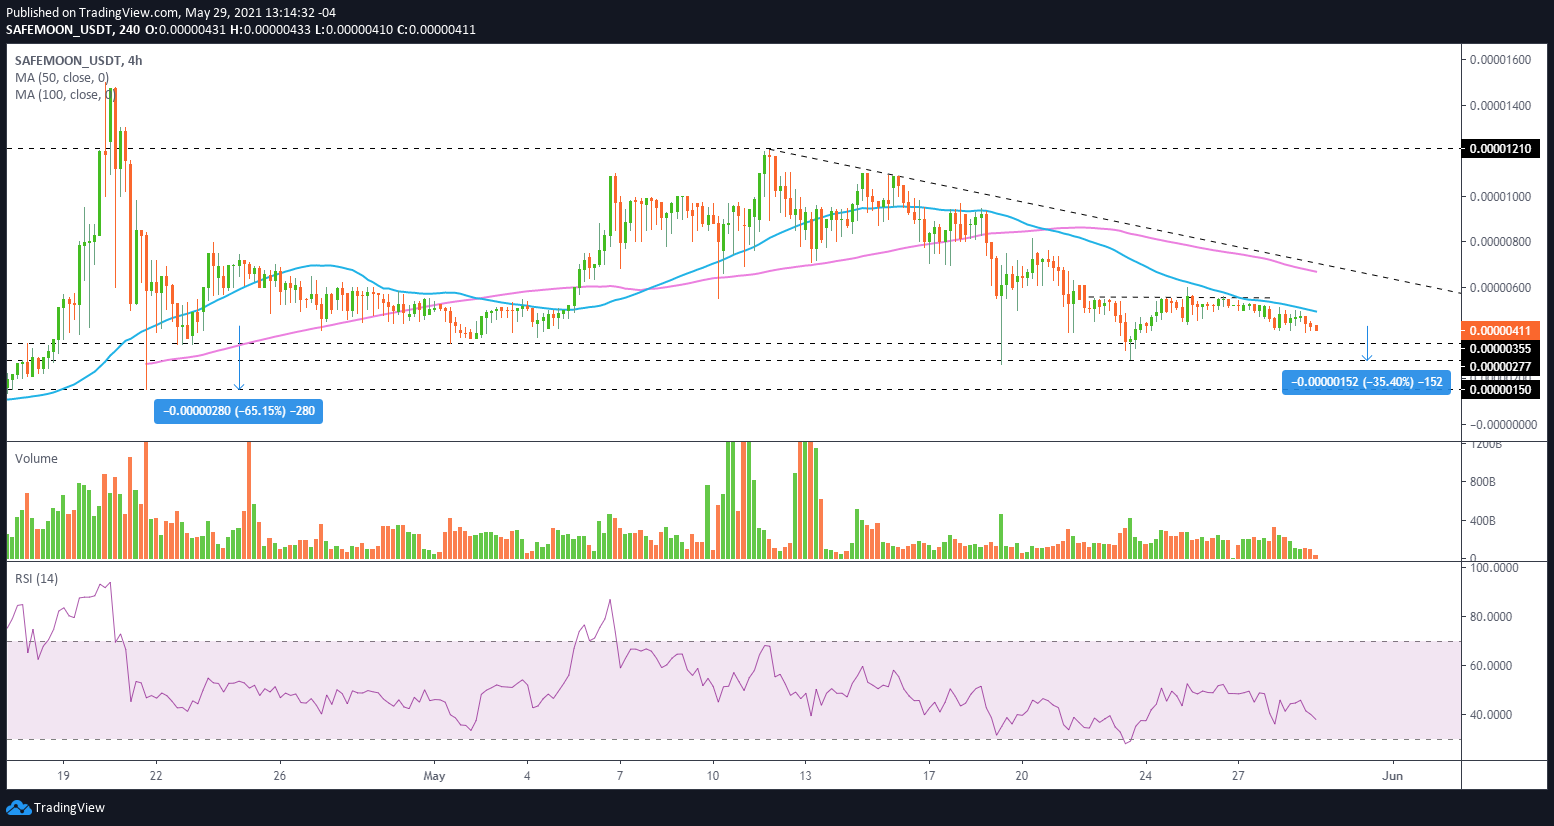
SAFEMOON/USD 4-hour chart
On the other hand, if SafeMoon price can stabilize in a price range above $0.00000355 and formulate a new, actionable pattern, SAFEMOON could quickly overcome the resistance outlined by the 50 four-hour SMA at $0.00000519.
A SafeMoon price close above the critical moving average on the four-hour chart would leave SAFEMOON free to test the confluence of the 200 four-hour SMA at $0.00000669 with the declining trend line from the May high at $0.00000700. Additional strength will find resistance at the $0.00001100-$0.00001200 price range.
Author

Sheldon McIntyre, CMT
Independent Analyst
Sheldon has 24 years of investment experience holding various positions in companies based in the United States and Chile. His core competencies include BRIC and G-10 equity markets, swing and position trading and technical analysis.


