- SAFEMOON price eyes key support, as 12H technical setup favors bears.
- Bears need 12H candlestick closing below 100-SMA.
- RSI remains bearish, looks to test the oversold region.
SAFEMOON price is wallowing near two-week lows of $0.000003983, down nearly 10% over the past 12 hours, as the sellers remain in complete control after this week’s market turbulence.
Despite several encouraging tweets by the auto-generating liquidity protocol since the mid-week crash, investors continue to lack conviction amid a persistent downbeat mood across the crypto markets, courtesy of the recent Chinese regulatory announcements.
SafeMoon hit lifetime highs of $0.000008419 on May 12, in response to a broader market advance and celebrity endorsements. The most recent celebrity to promote SafeMoon is Barstool Sports founder Dave Portnoy.
Additionally, the meme-based coin also drew support earlier this month after the company tweeted out, a video boasting it was "CertiK Approved."
SAFEMOON/USD: Technical indicators scream sell, more losses in the offing
The downside appears more compelling for SAFEMOON, especially after the price failed to resist above the 100-simple moving average (SMA) at $0.000004362 on the 12-hour chart.
The sellers now await a 12-hourly candlestick close below the abovementioned key support, in order to challenge the immediate line of defense at $0.000003670.
If the selling pressure intensifies, the next downside target is aligned at $0.000003062.
The Relative Strength Index (RSI) is on the track to test the oversold territory, currently around 35.50, suggesting there is a scope for additional downside.
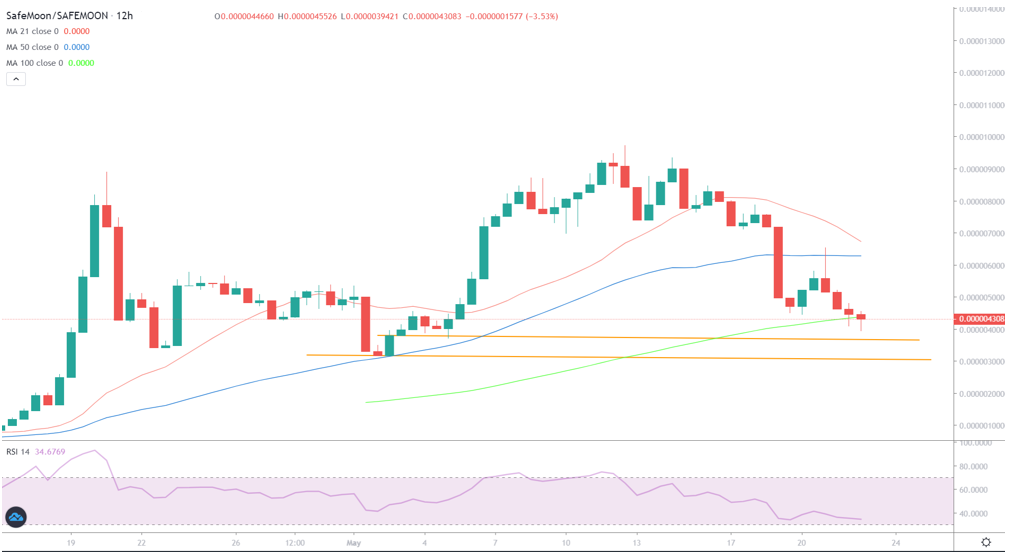
SAFEMOON/USD: 12-hour chart
However, should the bulls recapture the 100-SMA support-turned-resistance on a sustained basis, a recovery towards the $0.0000050 psychological barrier cannot be ruled out.
The horizontal 50-SMA resistance at $0.000006282 is the level to beat for the SAFEMOON bulls.
Information on these pages contains forward-looking statements that involve risks and uncertainties. Markets and instruments profiled on this page are for informational purposes only and should not in any way come across as a recommendation to buy or sell in these assets. You should do your own thorough research before making any investment decisions. FXStreet does not in any way guarantee that this information is free from mistakes, errors, or material misstatements. It also does not guarantee that this information is of a timely nature. Investing in Open Markets involves a great deal of risk, including the loss of all or a portion of your investment, as well as emotional distress. All risks, losses and costs associated with investing, including total loss of principal, are your responsibility. The views and opinions expressed in this article are those of the authors and do not necessarily reflect the official policy or position of FXStreet nor its advertisers. The author will not be held responsible for information that is found at the end of links posted on this page.
If not otherwise explicitly mentioned in the body of the article, at the time of writing, the author has no position in any stock mentioned in this article and no business relationship with any company mentioned. The author has not received compensation for writing this article, other than from FXStreet.
FXStreet and the author do not provide personalized recommendations. The author makes no representations as to the accuracy, completeness, or suitability of this information. FXStreet and the author will not be liable for any errors, omissions or any losses, injuries or damages arising from this information and its display or use. Errors and omissions excepted.
The author and FXStreet are not registered investment advisors and nothing in this article is intended to be investment advice.
Recommended Content
Editors’ Picks
Ripple's move above this key level could trigger nearly 50% rally for XRP
Ripple has overcome a critical resistance level and flipped into a support floor on the weekly time frame. This development happened while XRP tightly consolidated for roughly 250 days. Investors can expect XRP to kickstart a massive rally.
Optimism price outlook with nearly $90 million worth of OP tokens flooding markets on Friday
Optimism volatility has shrunk in the ours leading to the network’s cliff unlock. It joins the likes of dYdX and Sui, which have similar events on their calendars. As token unlocks are often considered bearish catalysts, investors should brace for a reaction after the event.
Top 3 Price Prediction Bitcoin, Ethereum, Ripple: Retail watches from the sidelines with a bias for shorts
Bitcoin could clear $73,777 peak as BTC bulls resurface. Ethereum might fall 10% before next leg up as ETH RSI teases with sell signal. XRP could lose $0.6000 threshold as Ripple bulls fail to show up.
Jito price could hit $6 as JTO coils up inside this bullish pattern
Jito price action shows a potential cup and handle formation. Based on theoretical measurement rules, a successful breakout could yield a 56% rally to $6.0. A breakdown of the $3.86 support level would create a lower low for JTO and invalidate the bullish thesis.
Bitcoin: BTC may have recovered, but is it out of the woods?
Bitcoin’s (BTC) upward momentum has shown a significant decline for the past two weeks or so. This development led to a bearish signal on the weekly and an uncertain outlook on the monthly.