Renowned analyst affirms Uniswap price is poised to skyrocket by more than 133%
- Uniswap is holding above a critical descending parallel channel ahead of a possible breakout to $10.
- UNI’s active daily deposits have grown consistently since November 28, and this is a bullish signal.

Uniswap is up 5% in the last 24 hours despite rejection from levels above $4. The decentralized finance (DeFi) token seeks higher support before resuming the uptrend, likely to lead to a 133% rally in the near term.
Uniswap prepares for a massive liftoff to $10
NebraskanGooner, a renowned technical analyst and trader, has recently shared his thoughts regarding the direction UNI is likely to take in the coming days. The analyst believes “UNI looks ready to fly” and proposes a swing trade with a target of $10. He, however, pointed out that Uniswap has a chart history with a tendency to run.
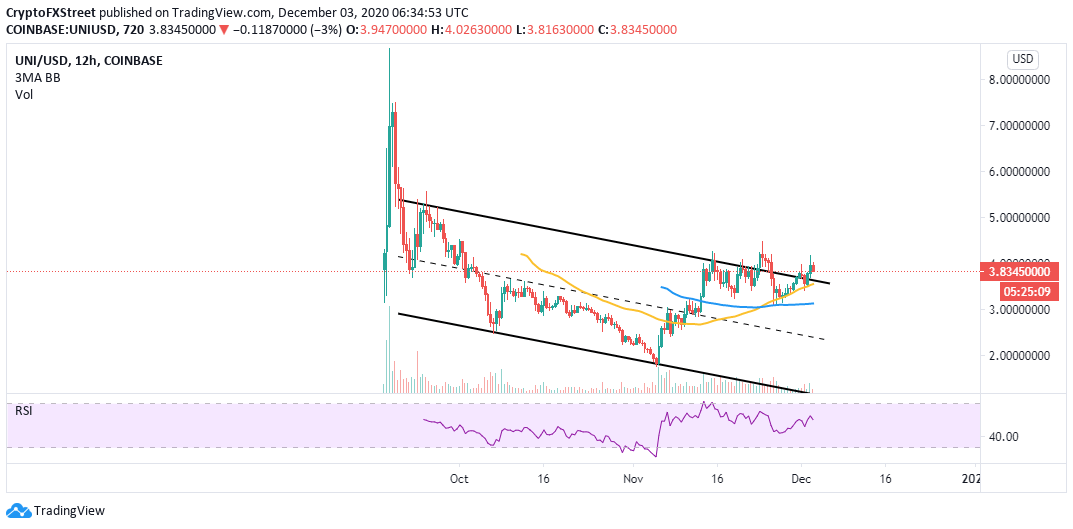
Meanwhile, at the time of writing, Uniswap is exchanging hands at $3.8. The token is also holding firmly above a descending parallel channel. The previous breakout above the channel failed to sustain the uptrend. However, if UNI can overcome the seller congestion at $4.2, there is a chance that the token will embark on a flash run towards $10.
Uniswap is also trading above the 50 Simple Moving Average on the daily chart, which adds credibility to the bullish outlook. A gap made by the 50 SMA above the 100 SMA reinforces the bulls’ influence in the market.
UNI/USD daily chart
Santiment, a leading provider of on-chain data and analysis, shows that Uniswap’s daily exchange deposits have been growing since November 28 from 157 UNI to 250 on December 3. The chart history illustrates that a spike in deposits usually increases the token’s price. Therefore, if the deposits continue to go up, there is a likelihood of UNI validating the uptrend.
%20[09.42.18,%2003%20Dec,%202020]-637425764689547588.png)
Uniswap daily active deposits chart
IntoTheBlock’s IOMAP model shows that UNI is trading under one strong barrier, currently hindering the anticipated breakout. The seller congestion zone runs from $3.84 to $3.95. Here, 4,200 addresses had previously bought roughly 32,000 UNI.
-637425768433862366.png)
Uniswap IOMAP chart
On the flip side, immense support exists to keep bears in check and prevent possible losses to $3.5. The most robust buyer congestion zone holds between $3.6 and $3.7. Here, roughly 3,300 addresses had previously purchased 70.8 million UNI. Uniswap might retreat to this support before embarking on the uptrend to $10.
Author

John Isige
FXStreet
John Isige is a seasoned cryptocurrency journalist and markets analyst committed to delivering high-quality, actionable insights tailored to traders, investors, and crypto enthusiasts. He enjoys deep dives into emerging Web3 tren


