Uniswap Price Prediction: UNI flashes multiple sell signals projecting a correction towards $3
- Uniswap price has formed a bearish divergence with the RSI on the daily chart.
- It seems that multiple sell signals indicate the digital asset is poised for a correction.

Uniswap had a massive 155% bull rally from its low point of $1.75 on November 5. It seems that the digital asset is finally topping out after a strong rejection from $4.48 and several bearish indicators that have formed in the short-term.
Uniswap price might be poised for a pullback
On the daily chart, Uniswap price has formed a clear bearish divergence with the RSI. The digital asset got rejected from the top of $4.48 and plummeted to a low of $3.8, around 48 hours later.
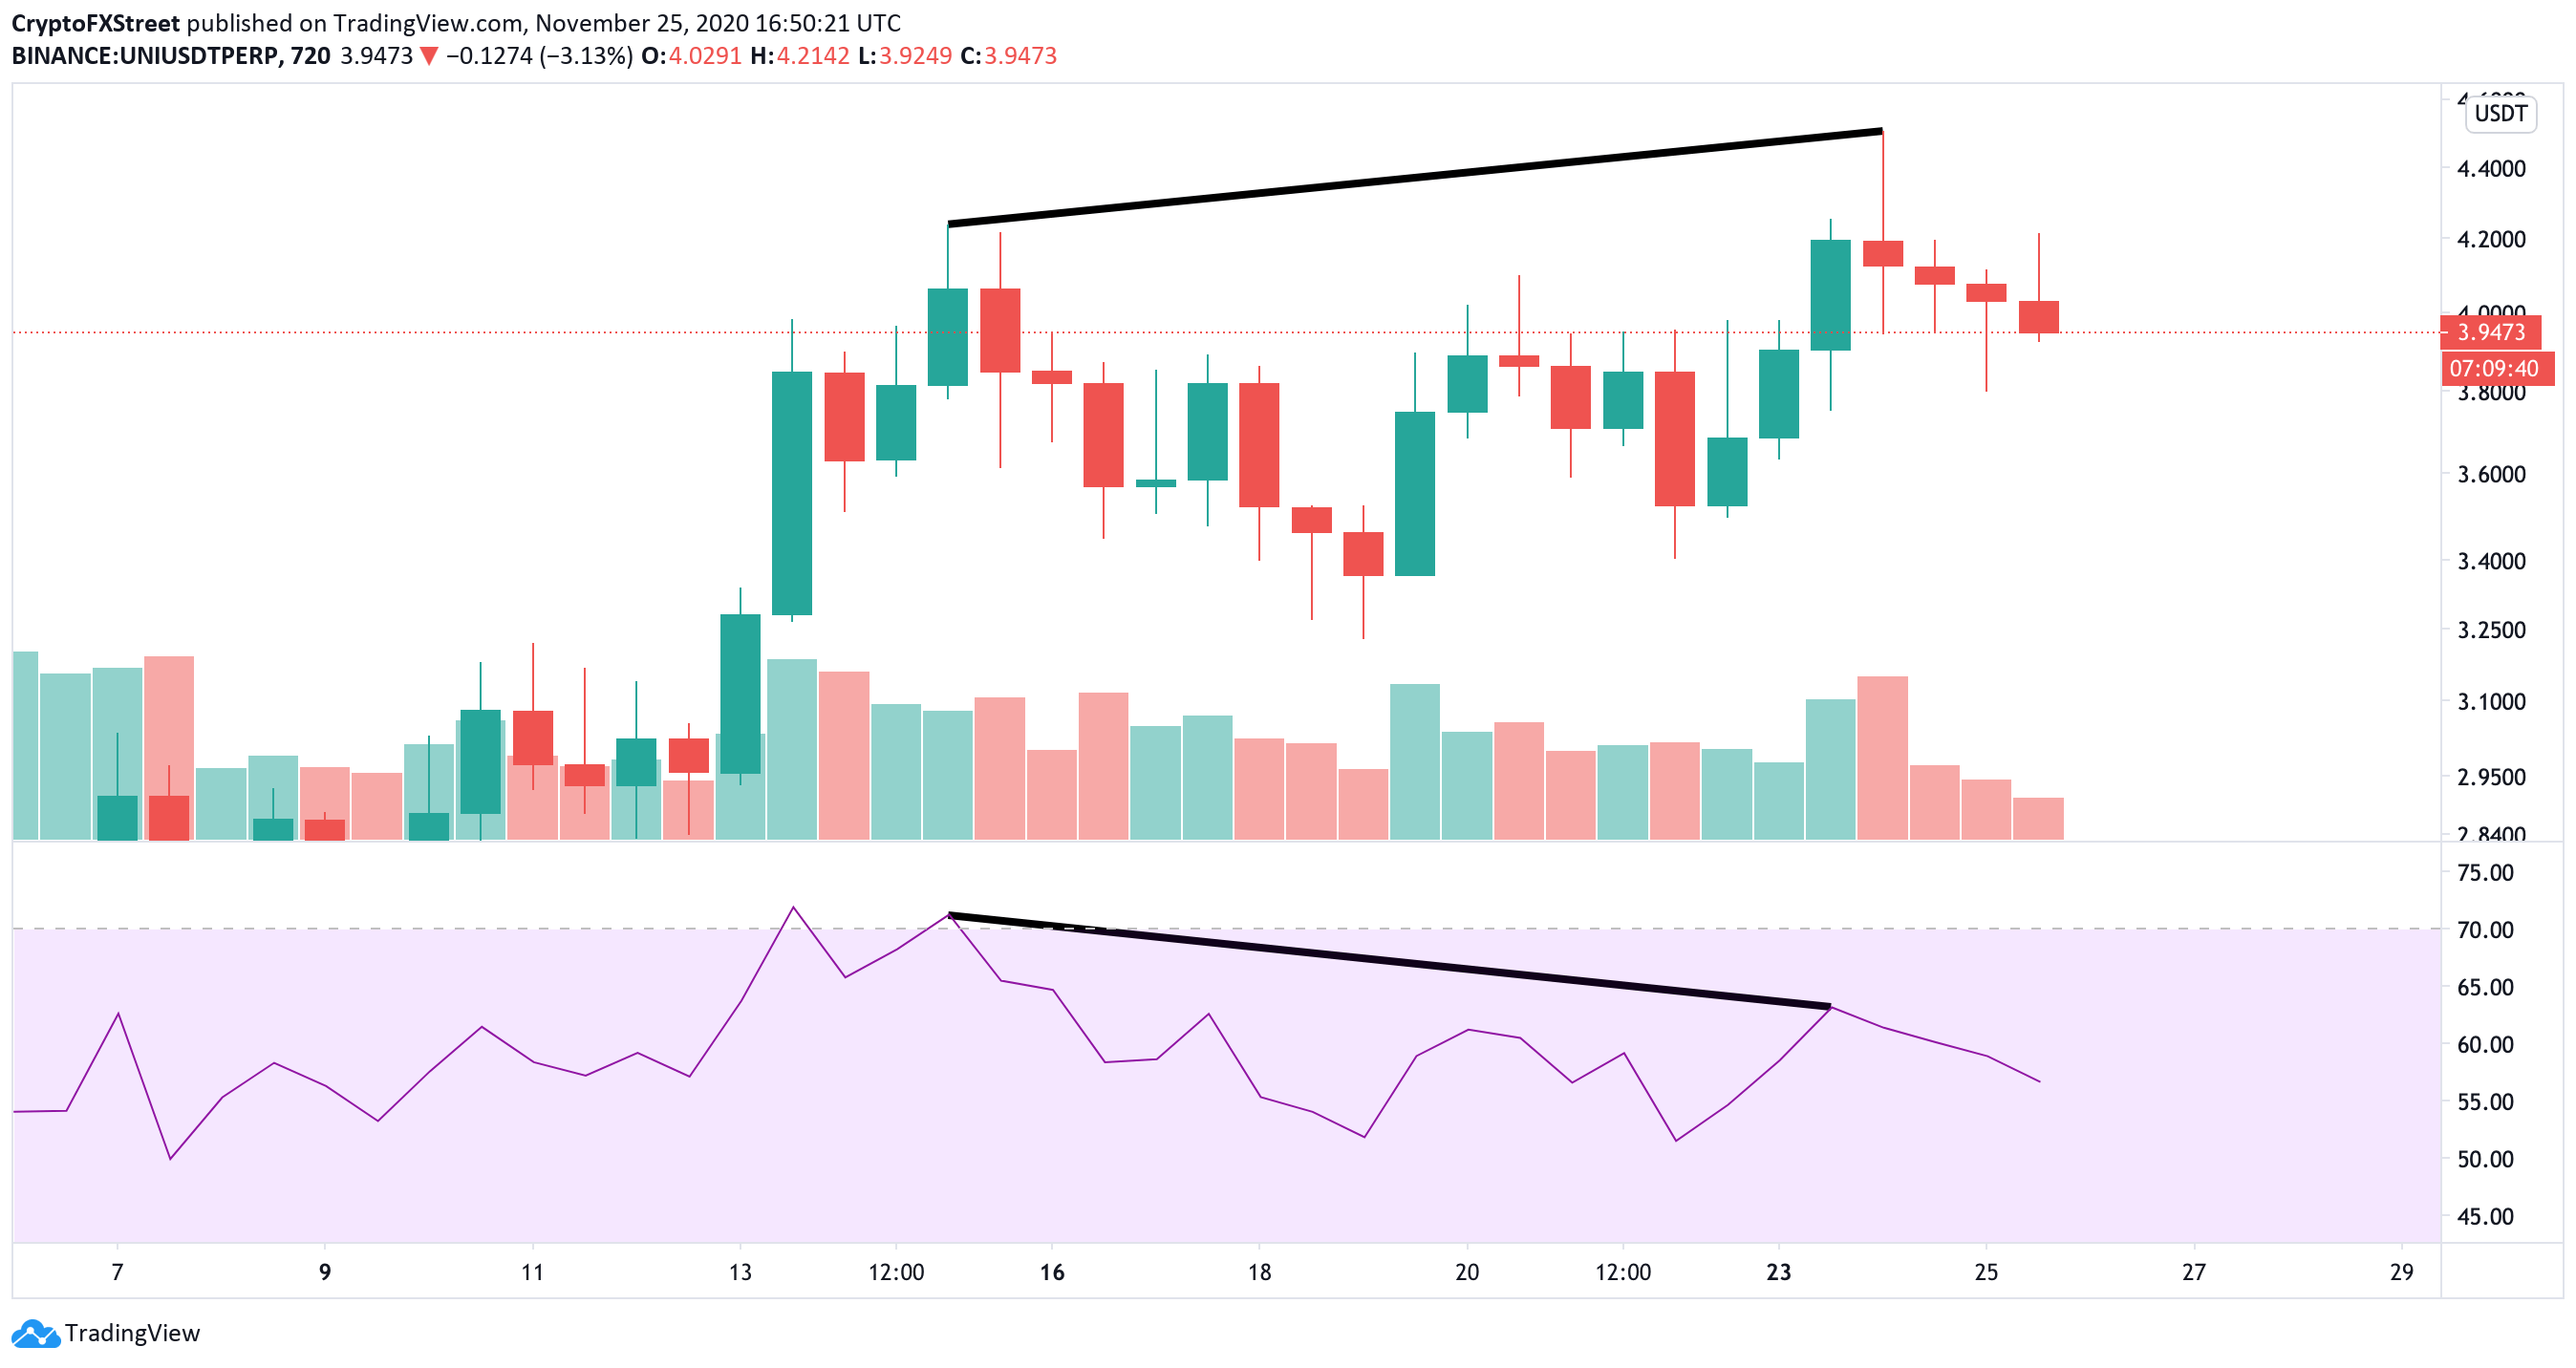
UNI/USD daily chart
Additionally, on the 12-hour chart, the MACD crossed bearishly as the 12-EMA and the 26-EMA also had a death cross, a heavily bearish indicator. This adds credence to the pessimistic outlook.
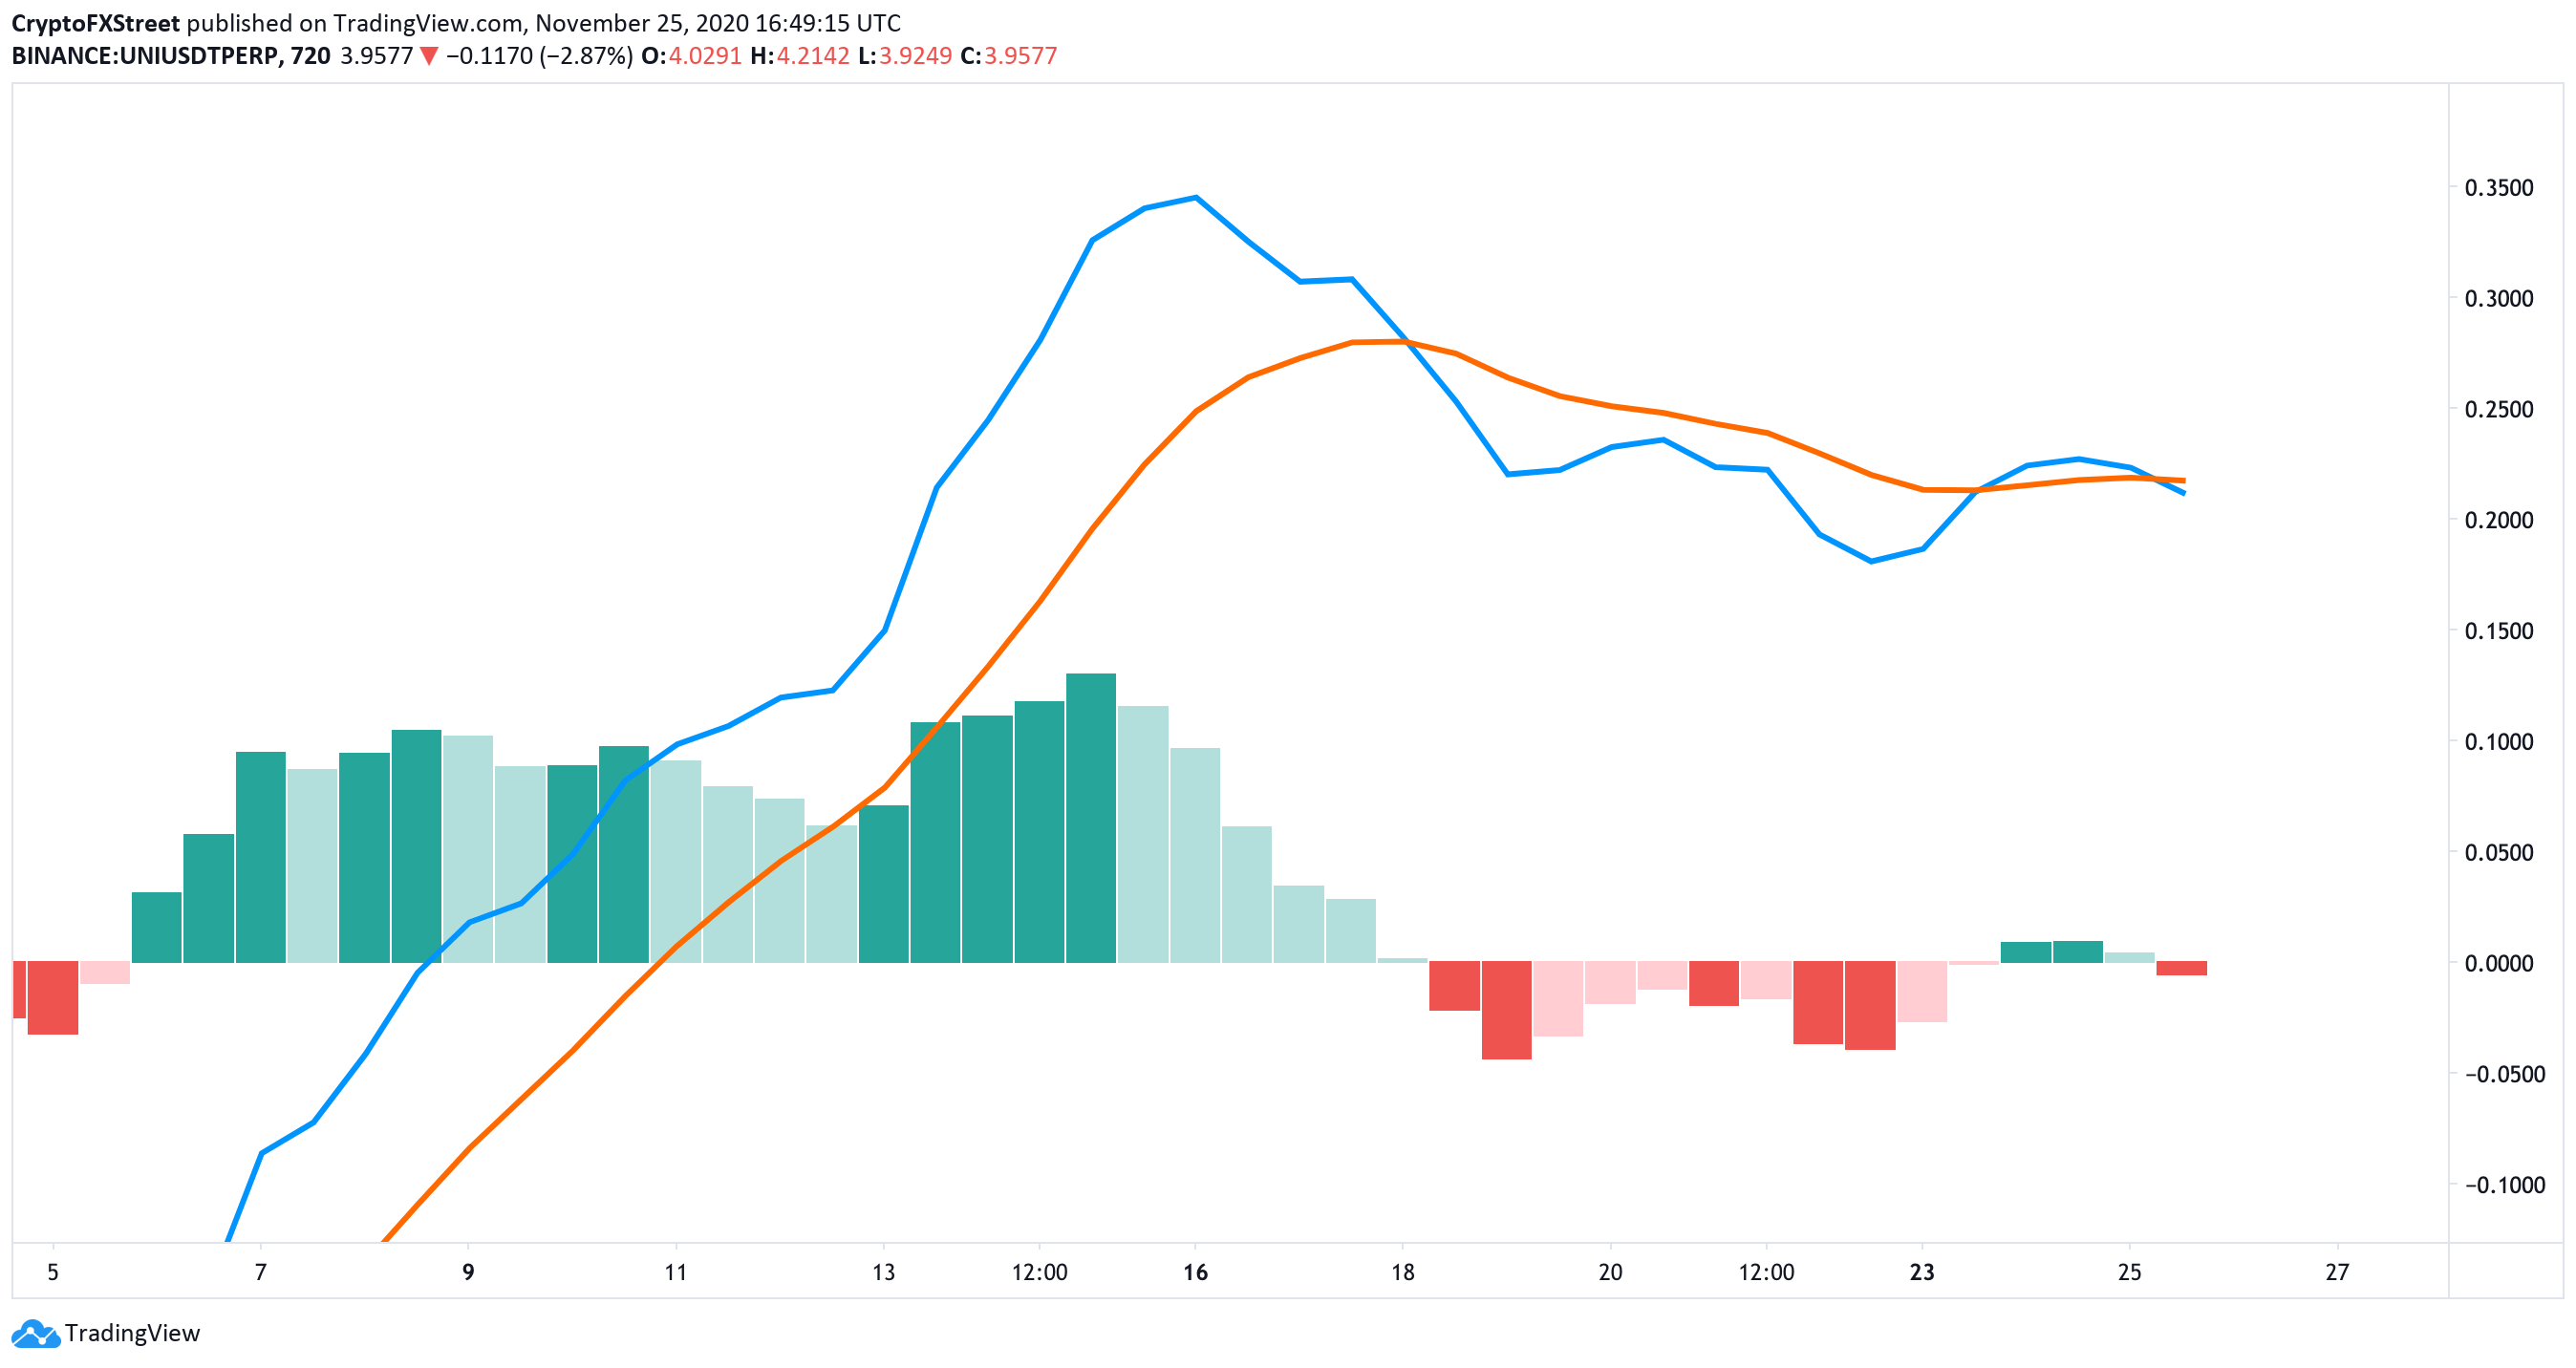
UNI/USD 12-hour chart
To determine potential price levels for the bears, we can use the Fibonacci Retracement indicator. It seems that the nearest price target would be the 0.5 Fib level at $3.13 followed by the 0.618 Fib level at $2.8.
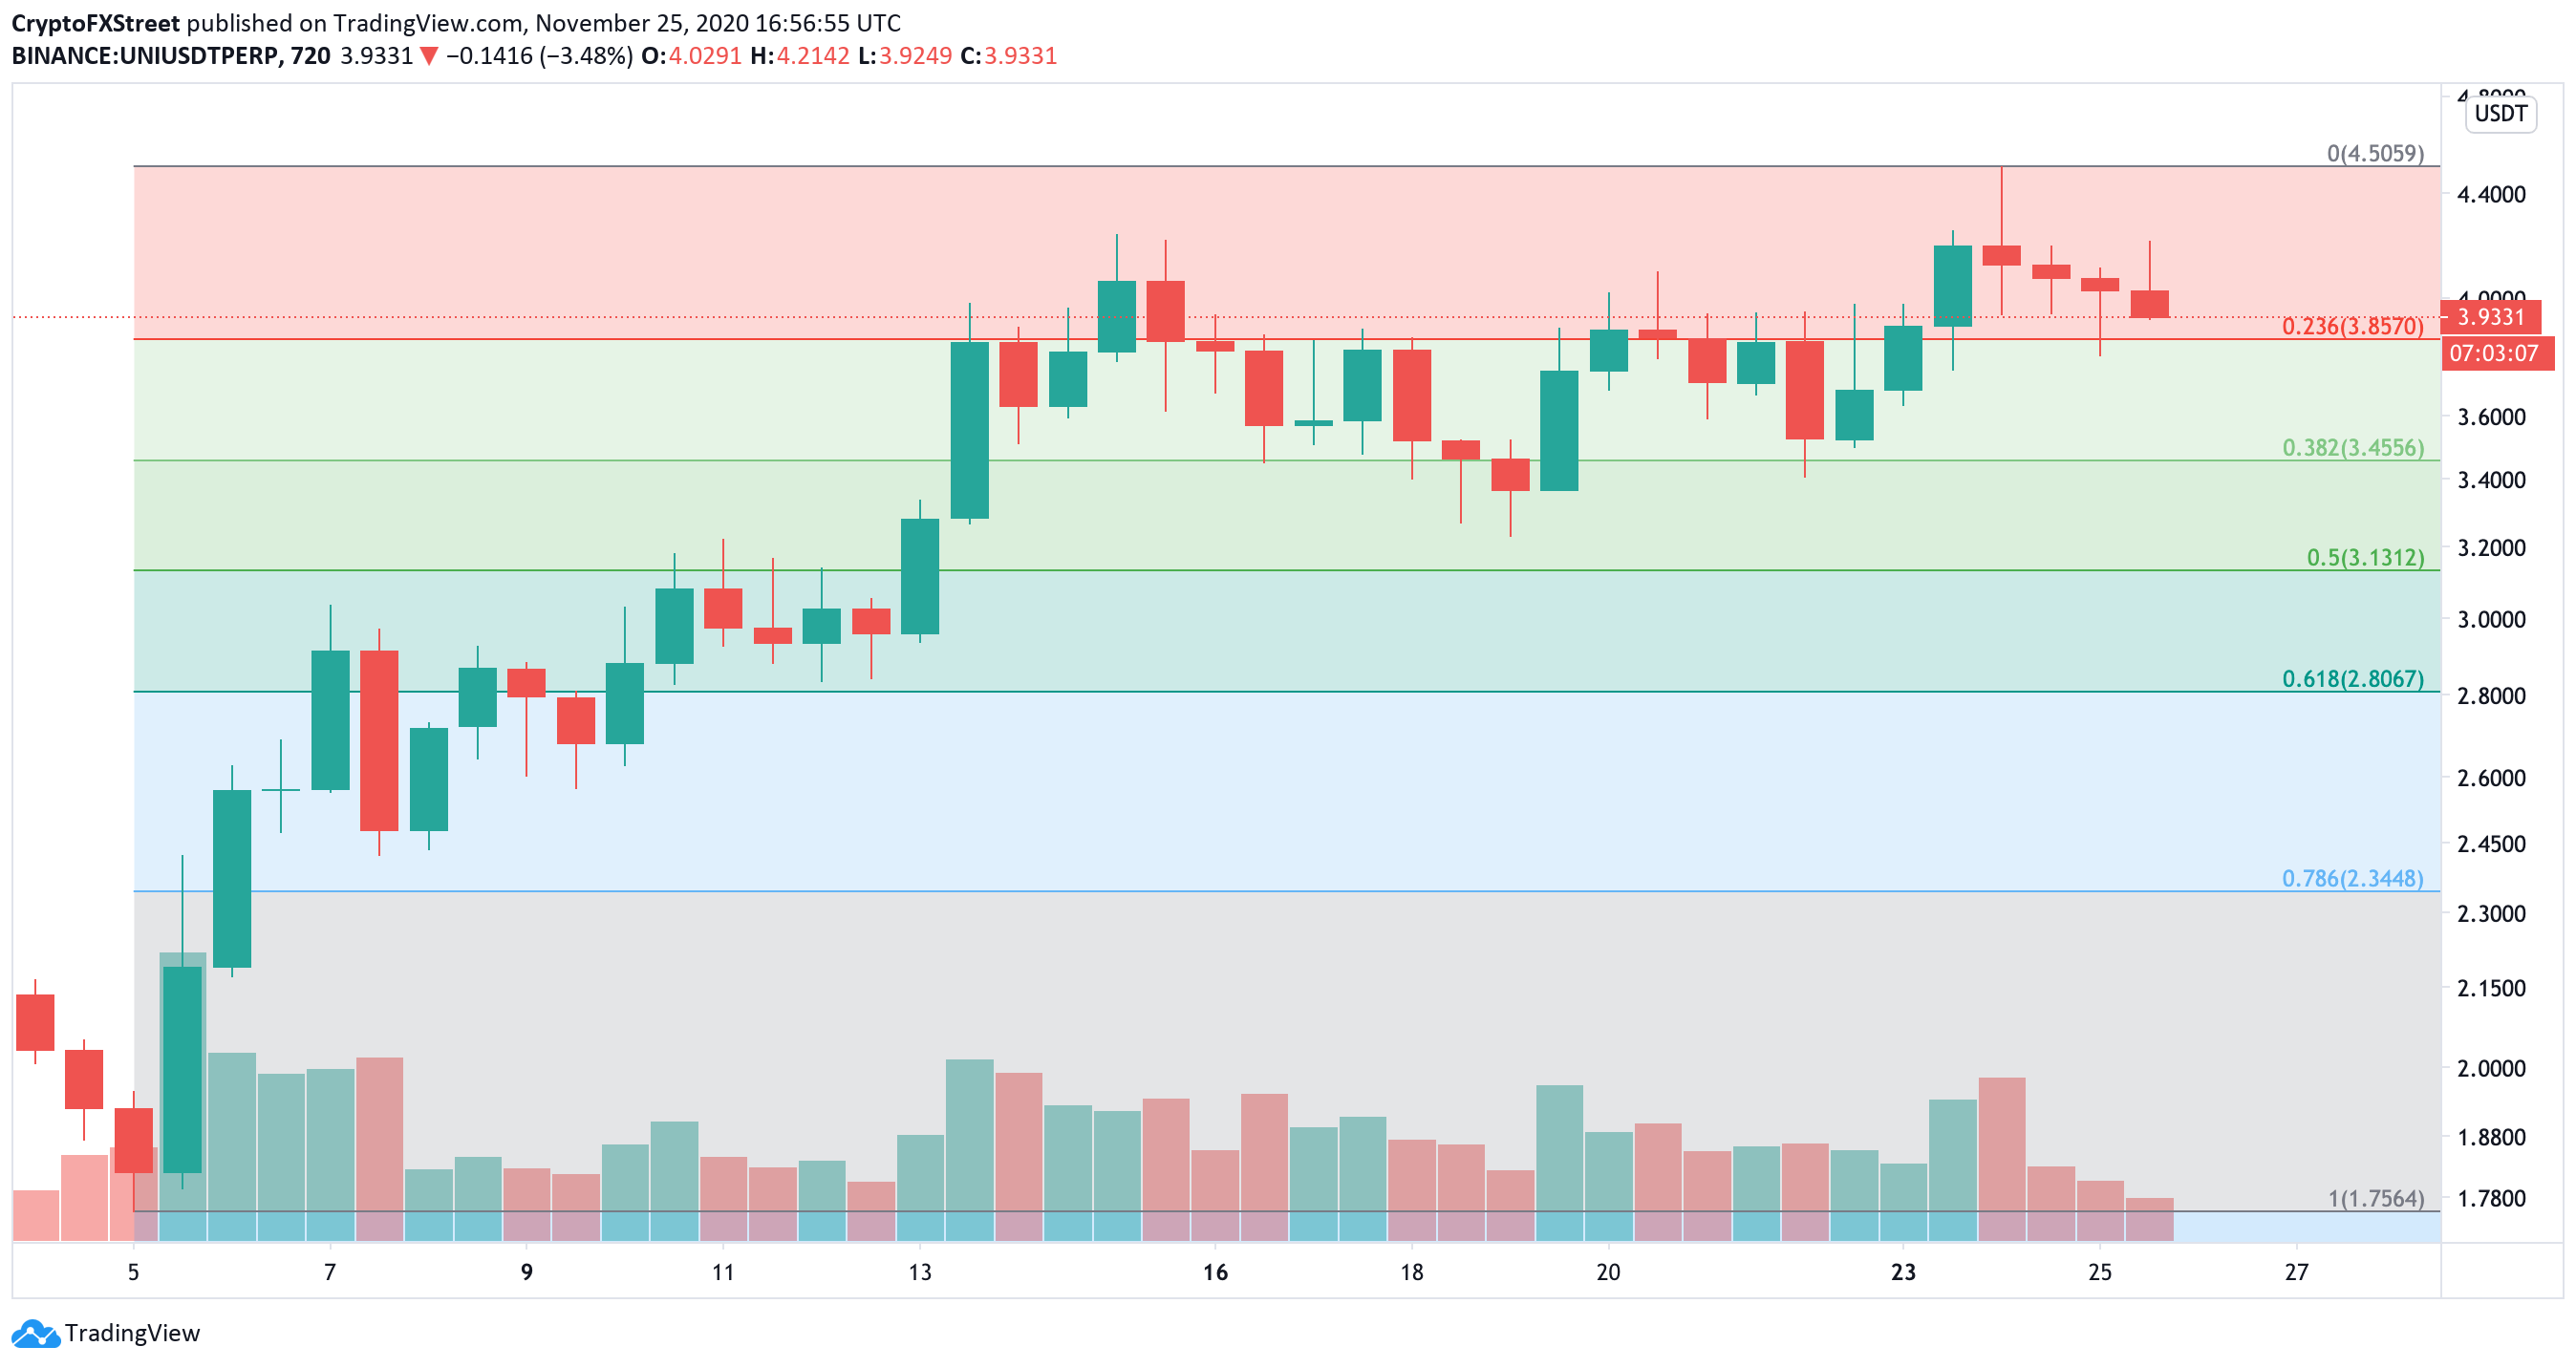
UNI/USD 12-hour chart
On the other hand, a breakout above the resistance trendline at $4.2 on the 12-hour chart would be a notable bullish indicator that could quickly drive Uniswap price towards $5.2 and up to $6.2 in the longer-term.
Author

Lorenzo Stroe
Independent Analyst
Lorenzo is an experienced Technical Analyst and Content Writer who has been working in the cryptocurrency industry since 2012. He also has a passion for trading.


