Uniswap price could be on the verge of a reversal, suggest technical patterns
- Uniswap price seems to be currently bounded inside a potential head-and-shoulders pattern.
- UNI could be aiming for a pullback as market investors grow greedy.

UNI is currently trading at $3.68 after a significant dip in the price to $3.38 as the entire market collapsed but managed to recover almost instantly. It also seems that the digital asset is trading inside a potential head and shoulders pattern with the neckline at $2.95.
Uniswap price might be poised for a correction
It seems that on the 4-hour chart, Uniswap price has formed a potential head-and-shoulders pattern, which is a bearish figure. If the pattern is confirmed, the right shoulder should take UNI towards $2.95.
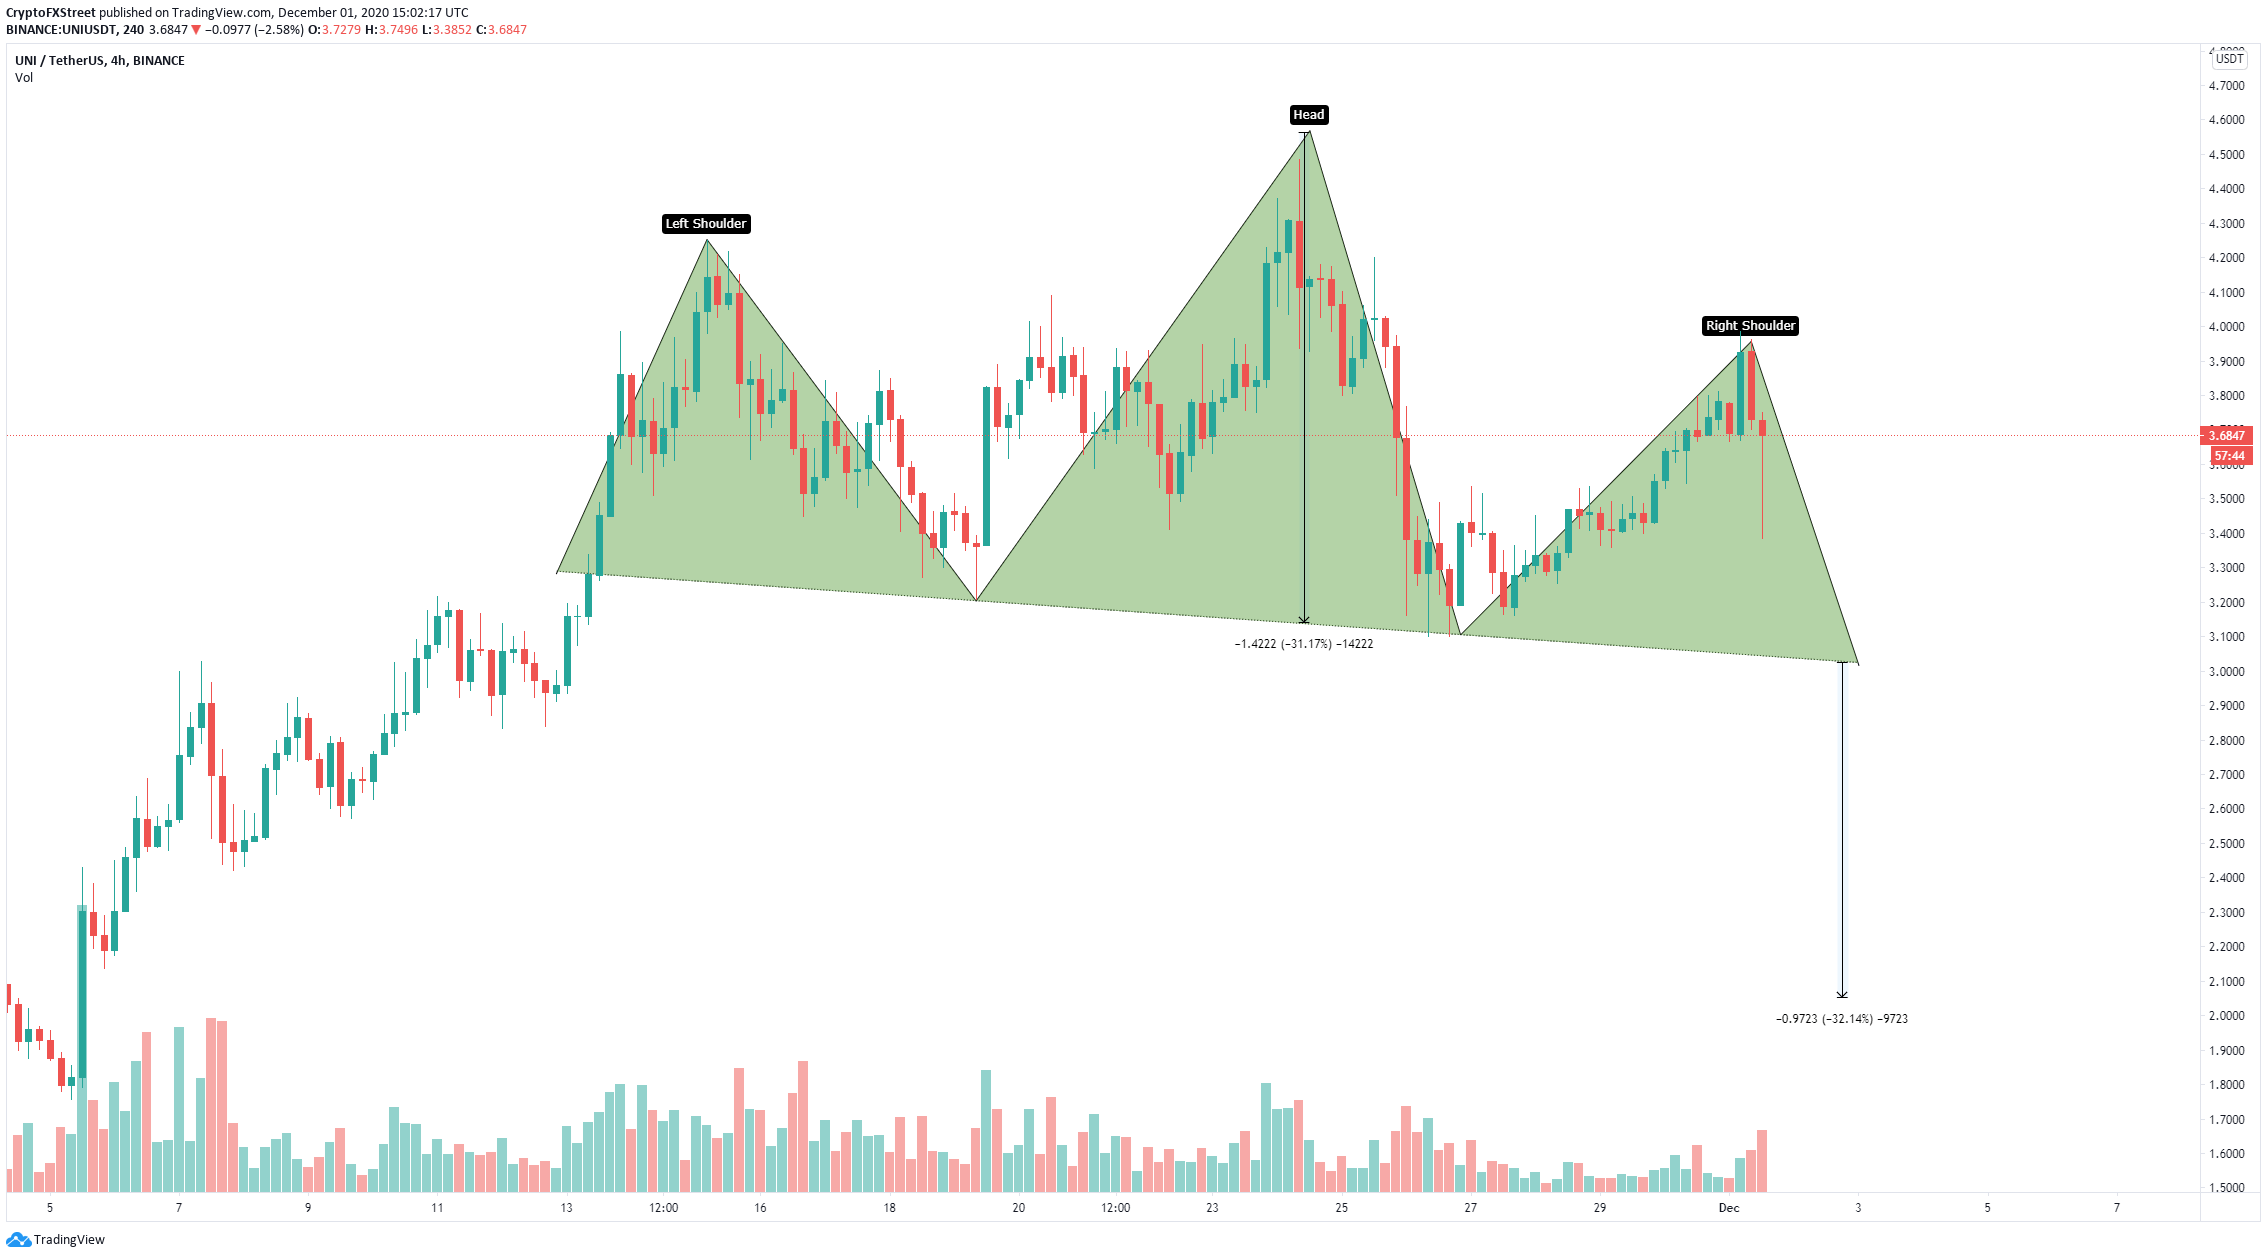
UNI/USD 4-hour chart
A breakdown below the neckline support at $2.95 could drive Uniswap price to the psychological level of $2. Additionally, some on-chain metrics have also turned bearish for Uniswap.
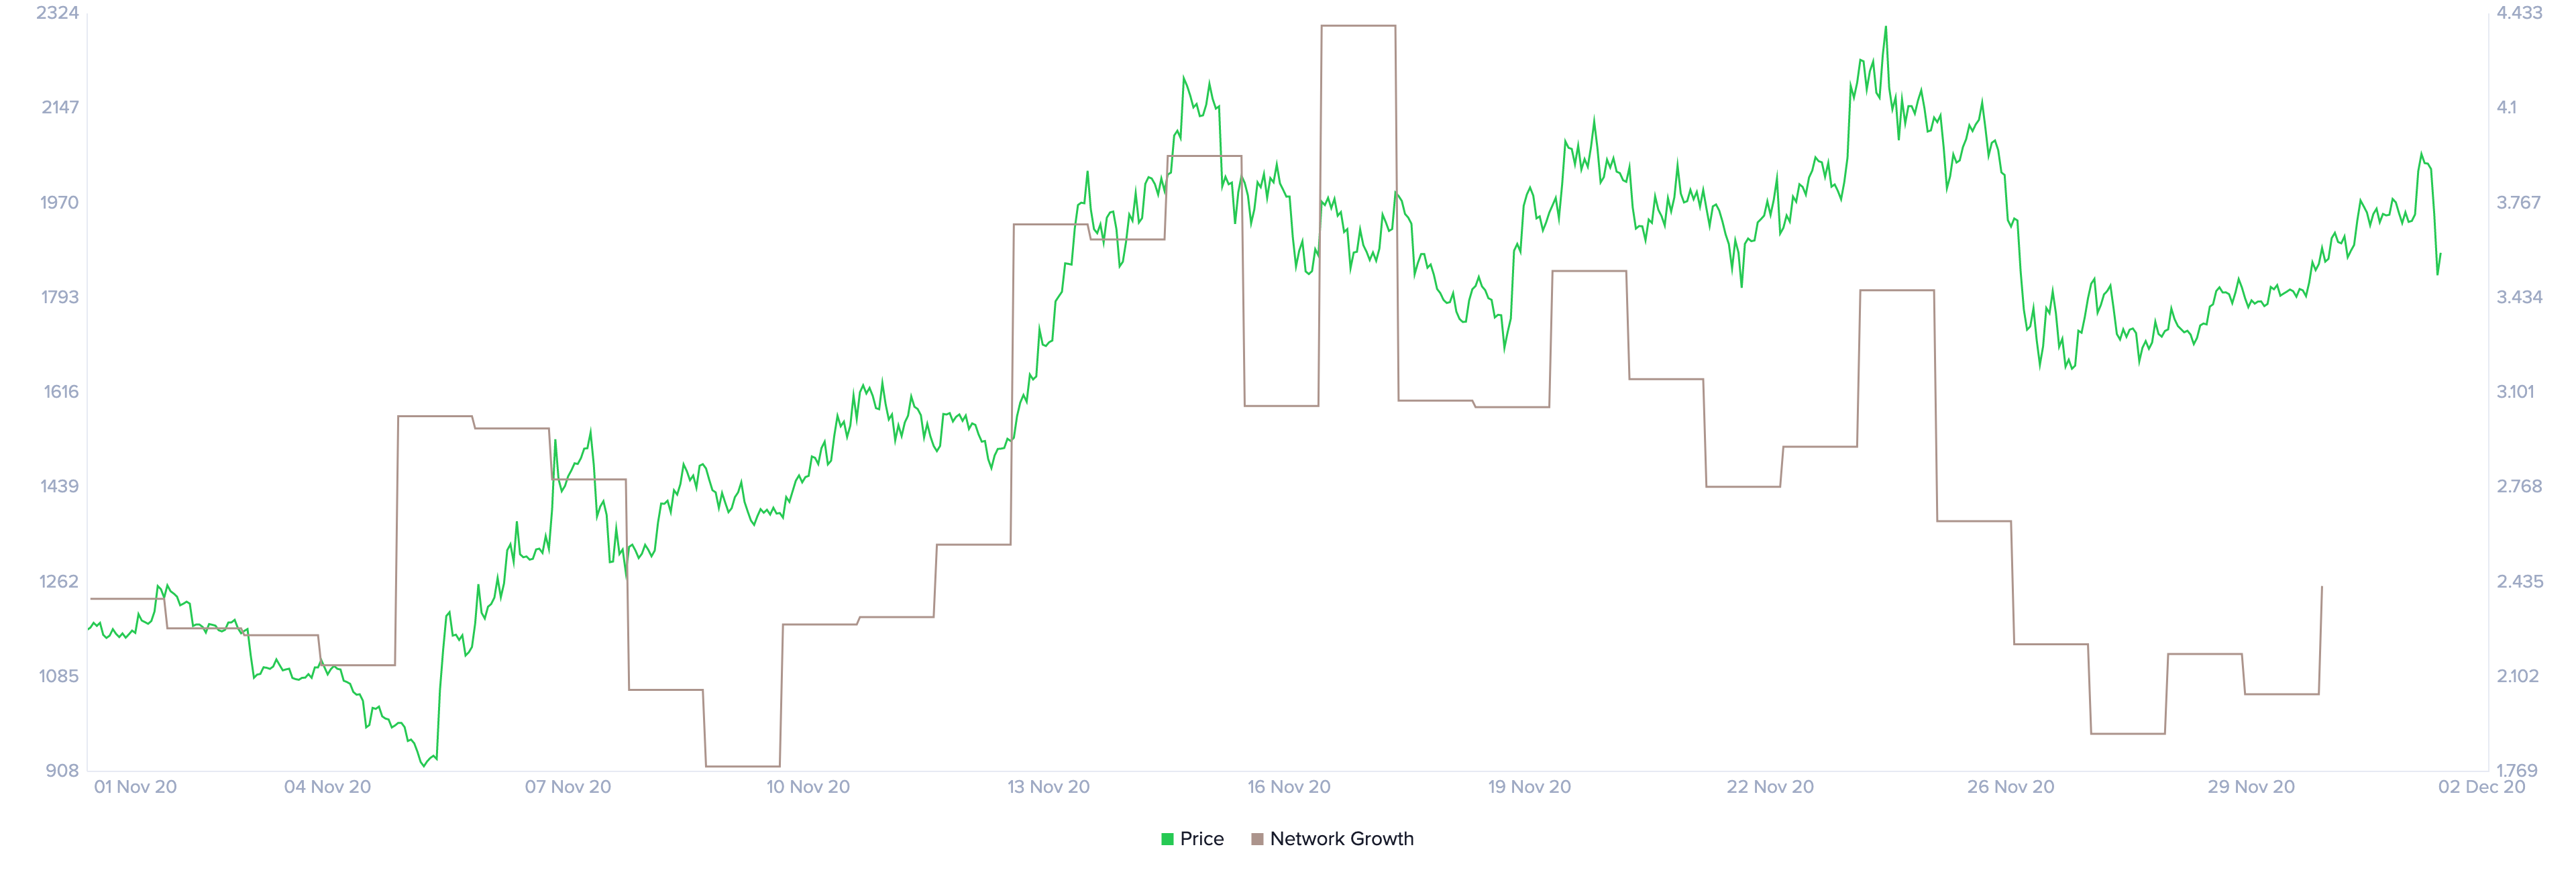
Uniswap Network Growth chart
It seems that the network growth of Uniswap has suffered a significant decline that started around November 17 dropping by more than 50% even though the price has remained relatively stable since then.
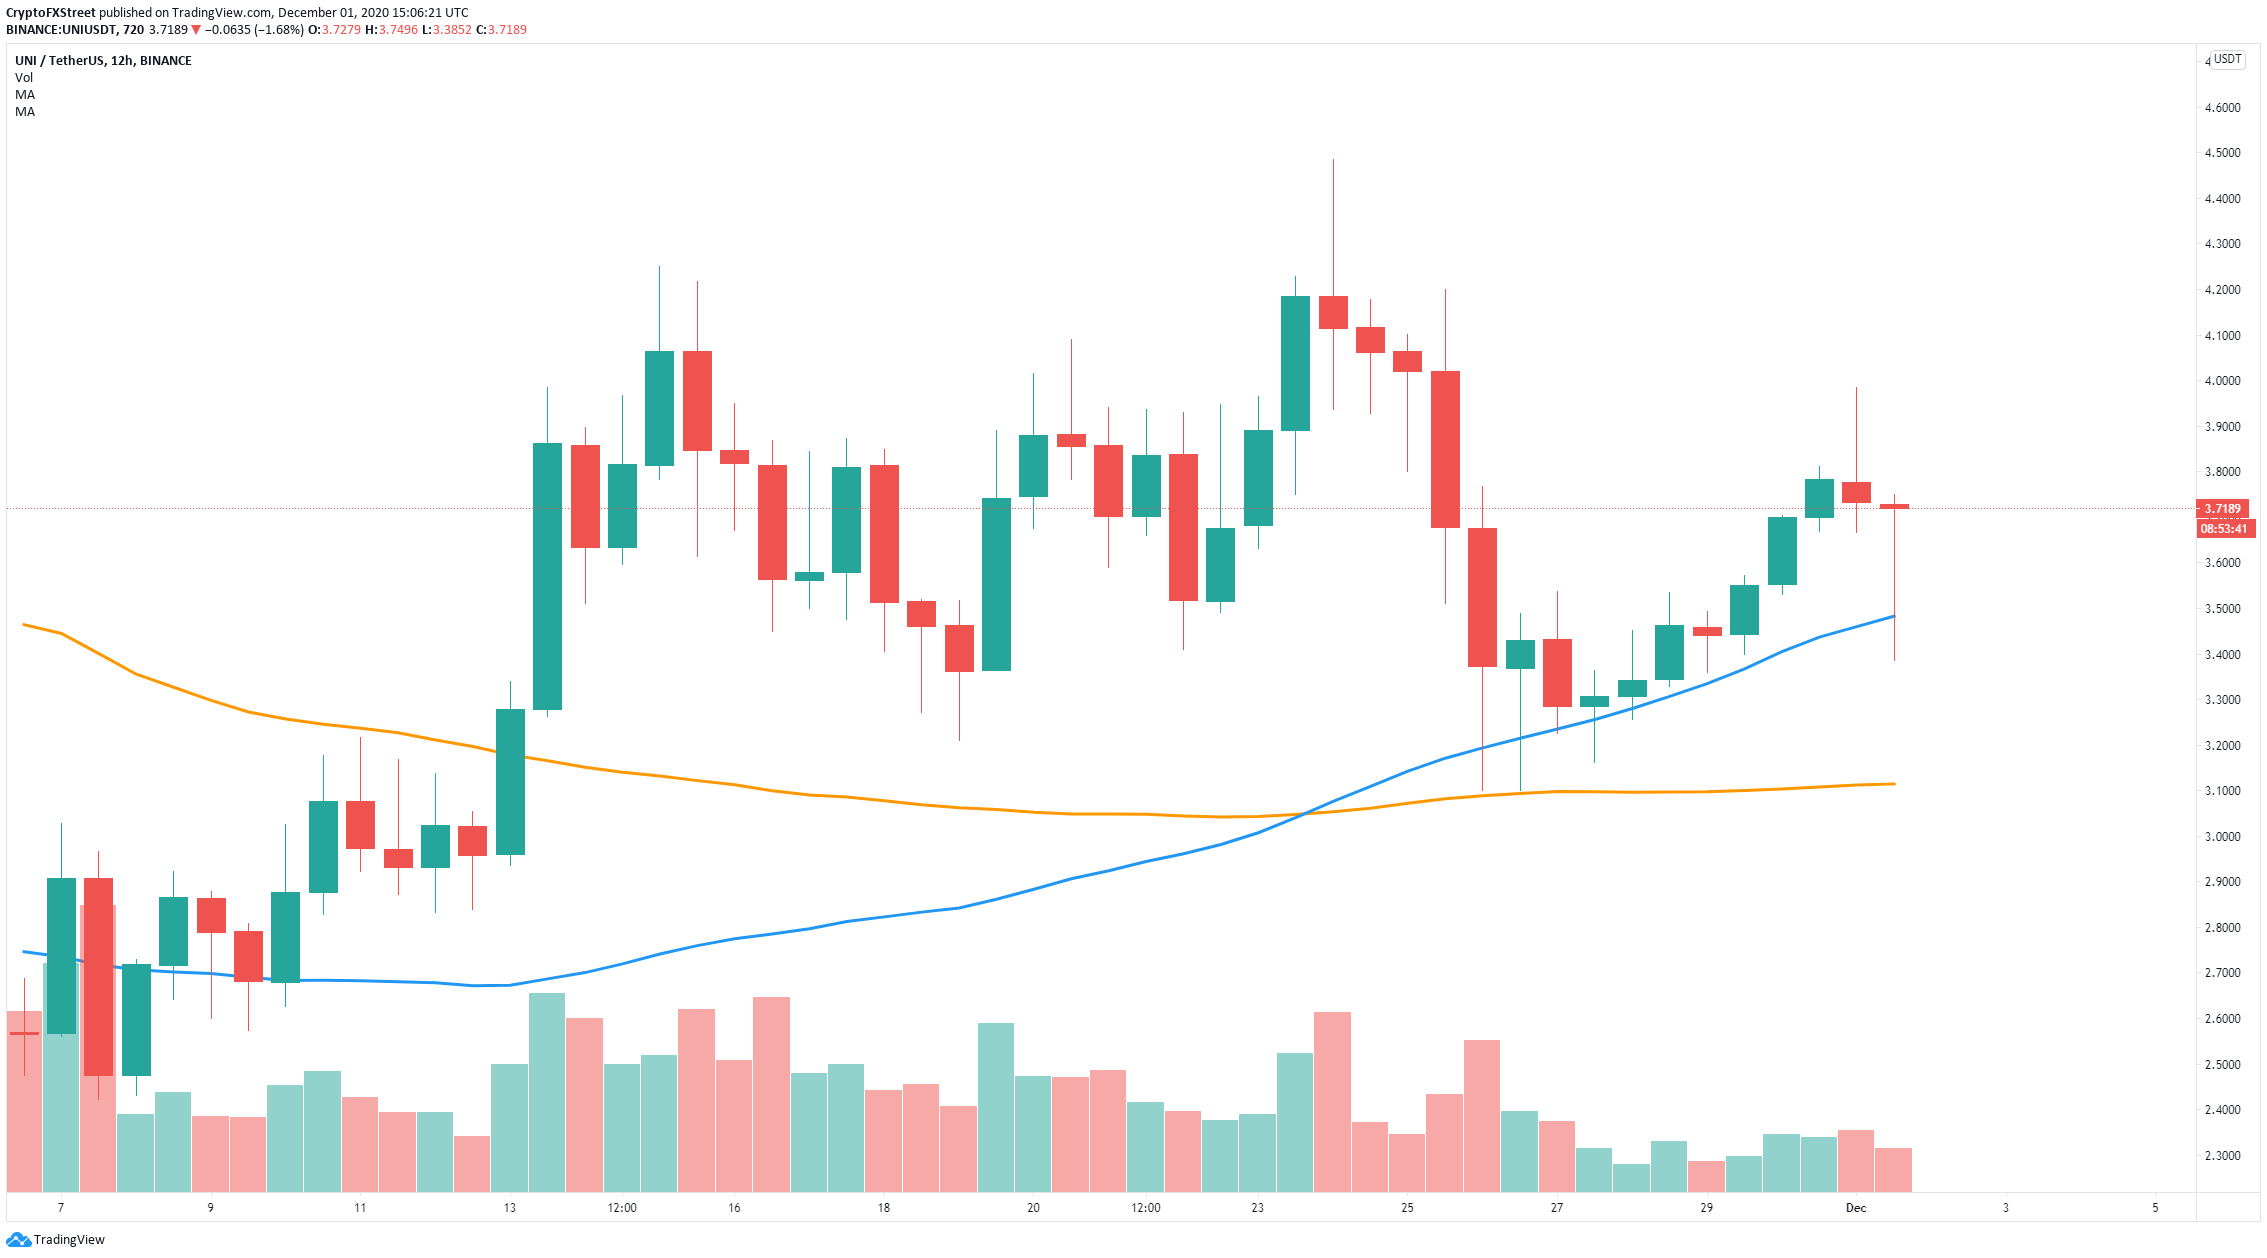
UNI/USD 12-hour chart
On the other hand, on the 12-hour chart, bulls have been able to defend the 100-SMA at $3.5 establishing a potential higher low compared to $3.1 and aiming to hit a higher high above $3.98, which would confirm an uptrend.
Author

Lorenzo Stroe
Independent Analyst
Lorenzo is an experienced Technical Analyst and Content Writer who has been working in the cryptocurrency industry since 2012. He also has a passion for trading.


