Polkadot Price Forecast: DOT on the cusp of a 40% breakout pursuing $6.3
- Polkadot symmetrical triangle pattern has been confirmed ahead of the potential liftoff to $6.3.
- DOT/USD will validate the upswing if the price breaks above the ascending channel’s upper boundary resistance.

Polkadot has lifted 11% upwards in the last 24 hours, and CoinMarketCap shows a bullish price action that gained 18% over the previous seven days. The token is in the middle of a barrier-breaking exercise, likely to catapult it to $6.3.
Polkadot building upon a key pattern breakout
DOT/USD is trading at $5.2 following a great liftoff above the symmetrical triangle pattern. A breakout from a symmetrical triangle pattern usually has a precise price target and, therefore, its formation is usually highly regarded in technical analysis. If the uptrend is sustained by first embracing support at $5, Polkadot might extend the breakout to $6.3 (triangle target).
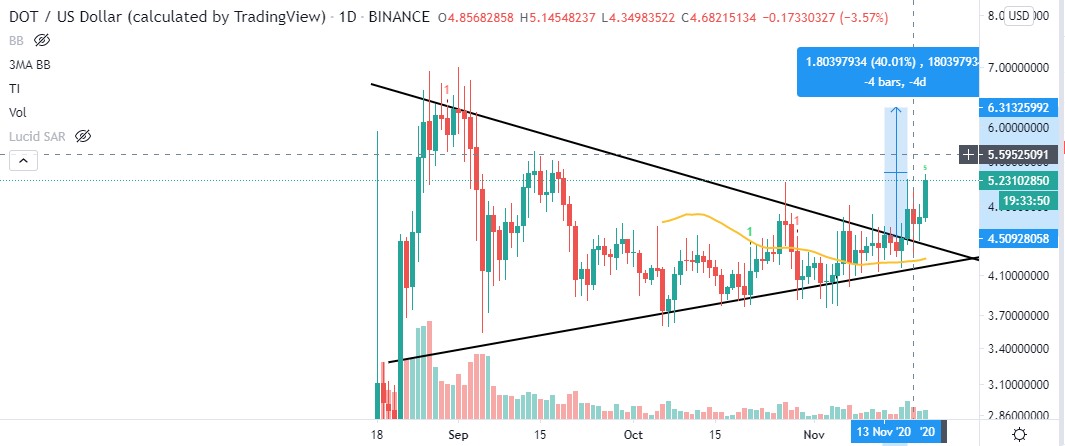
DOT/USD daily chart
The 4-hour chart illustrates the asset’s trading within an ascending parallel channel. DOT is seen dealing with the resistance at the channel’s upper boundary. A break above this area would boost the price towards the target at $6.3.
On the other hand, Polkadot is trading above all the three Simple Moving Averages in the 4-hour timeframe; the 50 SMA, 100 SMA, and 200 SMA. These levels will play a key role in stopping declines in case of a reversal.
Besides, trading above them shows that buyers have the upper hand, at least for now. The bullish outlook is also reinforced by the Relative Strength Index, as it has settled within the overbought region.
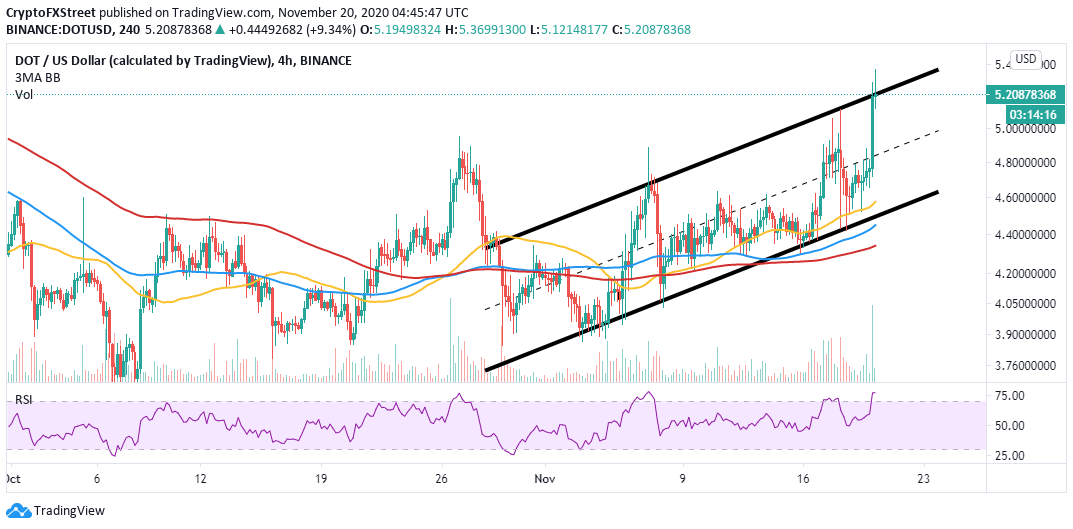
DOT/USD 4-hour chart
On the other hand, the 12-hour chart shows the possibility of a doubt-top pattern forming. If Polkadot fails to break above the resistance at $5.5, a reversal is most likely to come into the picture.
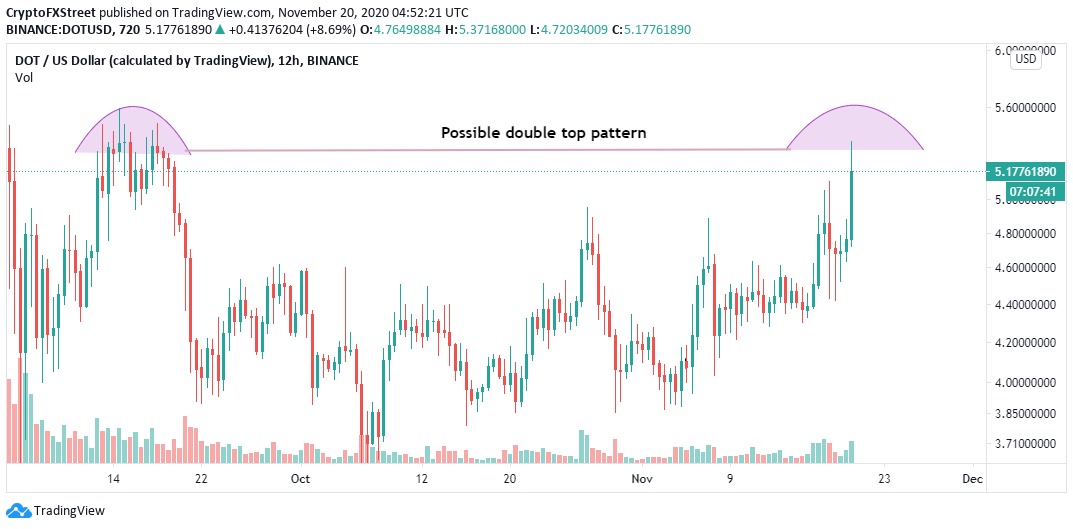
DOT/USD 12-hour chart
It is worth noting that a double-top pattern is an extremely bearish technical formation, which highlights the price stalling at the same high twice and failing to overcome the resistance. However, traders must wait for the pattern’s confirmation to ensure that they are not removed from a position too early.
Author

John Isige
FXStreet
John Isige is a seasoned cryptocurrency journalist and markets analyst committed to delivering high-quality, actionable insights tailored to traders, investors, and crypto enthusiasts. He enjoys deep dives into emerging Web3 tren


