Polkadot Price Forecast: DOT eyes breakout to $5 as market bottom beckons
- Polkadot price was rejected from the Bollinger band's middle boundary, hence the search for a bottom.
- DOT/USD anticipates a robut support above $4 ahead of a breakout eyeing $5.

Polkadot continued with the hunt for a bottom amid consolidation over the weekend. The price is teetering at $4.4, as bulls work around the clock to find a formidable bottom. The least resistance path is horizontal, especially with the Relative Strength Index on the 4-hour chart holding above 40.
Polkadot consolidation approaches the tipping point
The 4-hour chart shows DOT/USD exploring the downside after rejection from the 100 Simple Moving Average (SMA). Support is envisioned at $4.3, but DOT might seek a cushion above $4, as shown on the chart if declines slice through. A market bottom is anticipated in this range, with DOT likely to resume the uptrend from here.
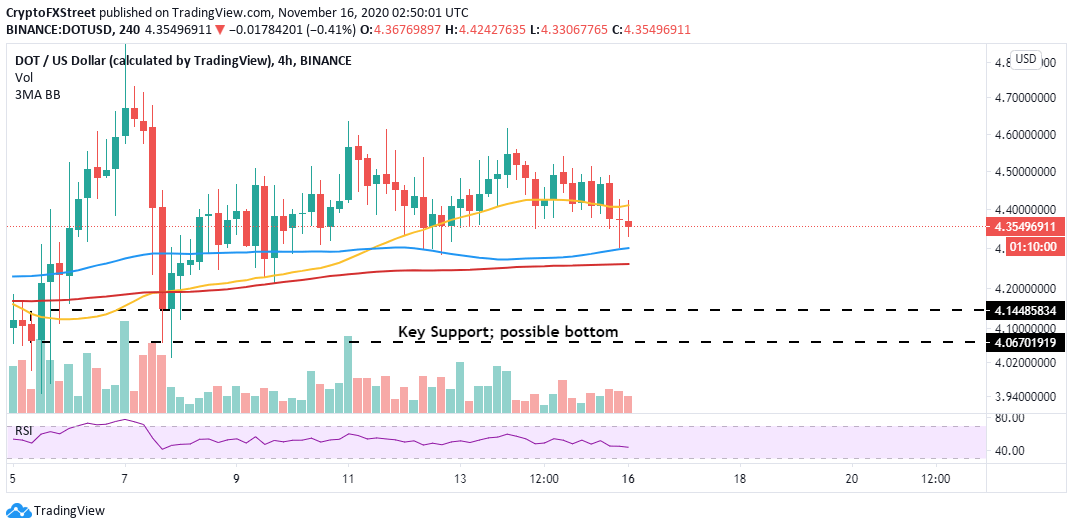
DOT/USD 4-hour chart
The hunt for a formidable bottom is in full gear now that Polkadot is trading under the Bollinger band's middle boundary. According to the Moving Average Convergence Divergence (MACD) on the 1-hour chart, the cryptoasset is bound to retrace some more before a significant breakout comes into the picture. Perhaps from the critical support range mentioned above.
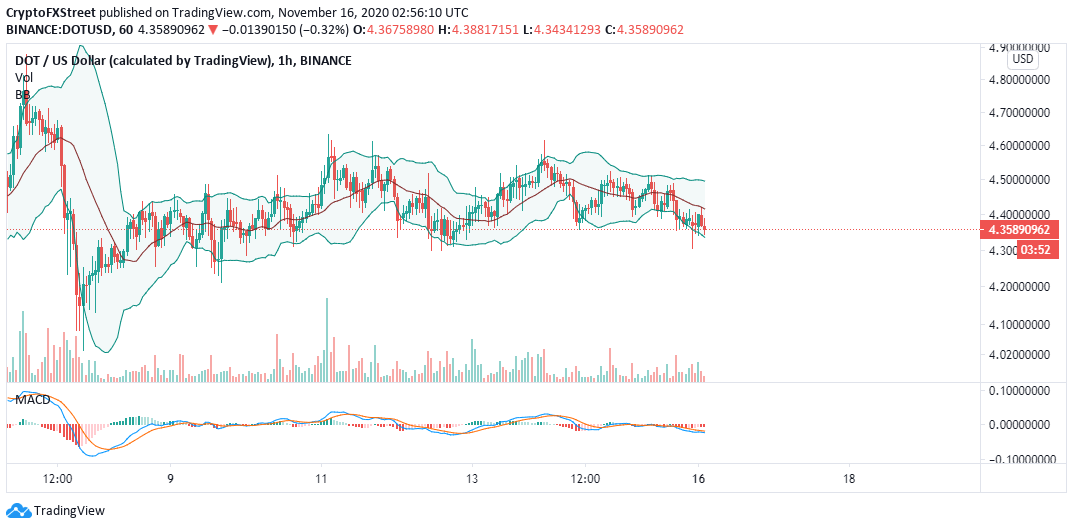
DOT/USD 1-hour chart
It is worth mentioning that DOT/USD will invalidate the downtrend and immediately breakout if it closes the day above the 200 SMA in the hourly timeframe. Some delay is expected at the confluence created by the 50 SMA and the 100 SMA. However, if bulls manage to step above this zone, DOT could embark on a breakout to $5.
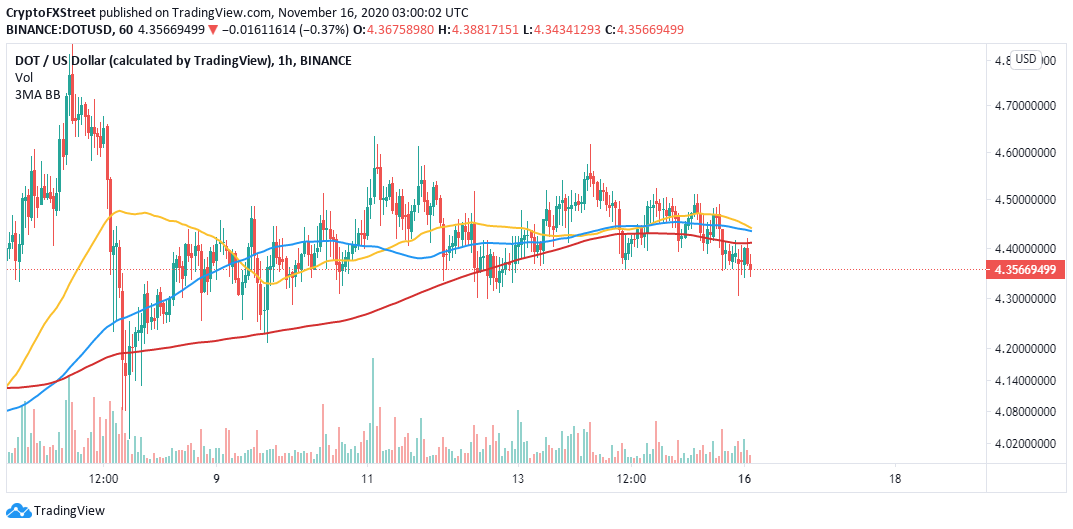
DOT/USD 1-hour chart
Polkadot currently holds the ninth position in the market. It has a $3.8 billion market cap and attracted a 24-hour trading volume of $366 million. The platform supports cross-border blockchain transfers for assets and data. The network stands out for its ability to upgrade without the need for hard forks.
Author

John Isige
FXStreet
John Isige is a seasoned cryptocurrency journalist and markets analyst committed to delivering high-quality, actionable insights tailored to traders, investors, and crypto enthusiasts. He enjoys deep dives into emerging Web3 tren


