Ontology Price Analysis: ONT may lose 17% of its value, technical indicator shows
- The technical picture of ONT/USD implies that the coin is ready for a downside correction.
- The launch of "Stake ONT to Mine WING" may slow down the bears.

Ontology (ONT) takes the 34th place in the global cryptocurrency market rating by total market value. At the time of writing, ONT/USD is changing hands at $0.842, gaining over 7% in the last 24 hours. ONT has a market capitalization of $589 million and an average daily trading volume of $611 million, twice as much as during the previous week. The coin is most actively traded on Binance and OKEx against USDT.
This technical indicator means trouble for ONT
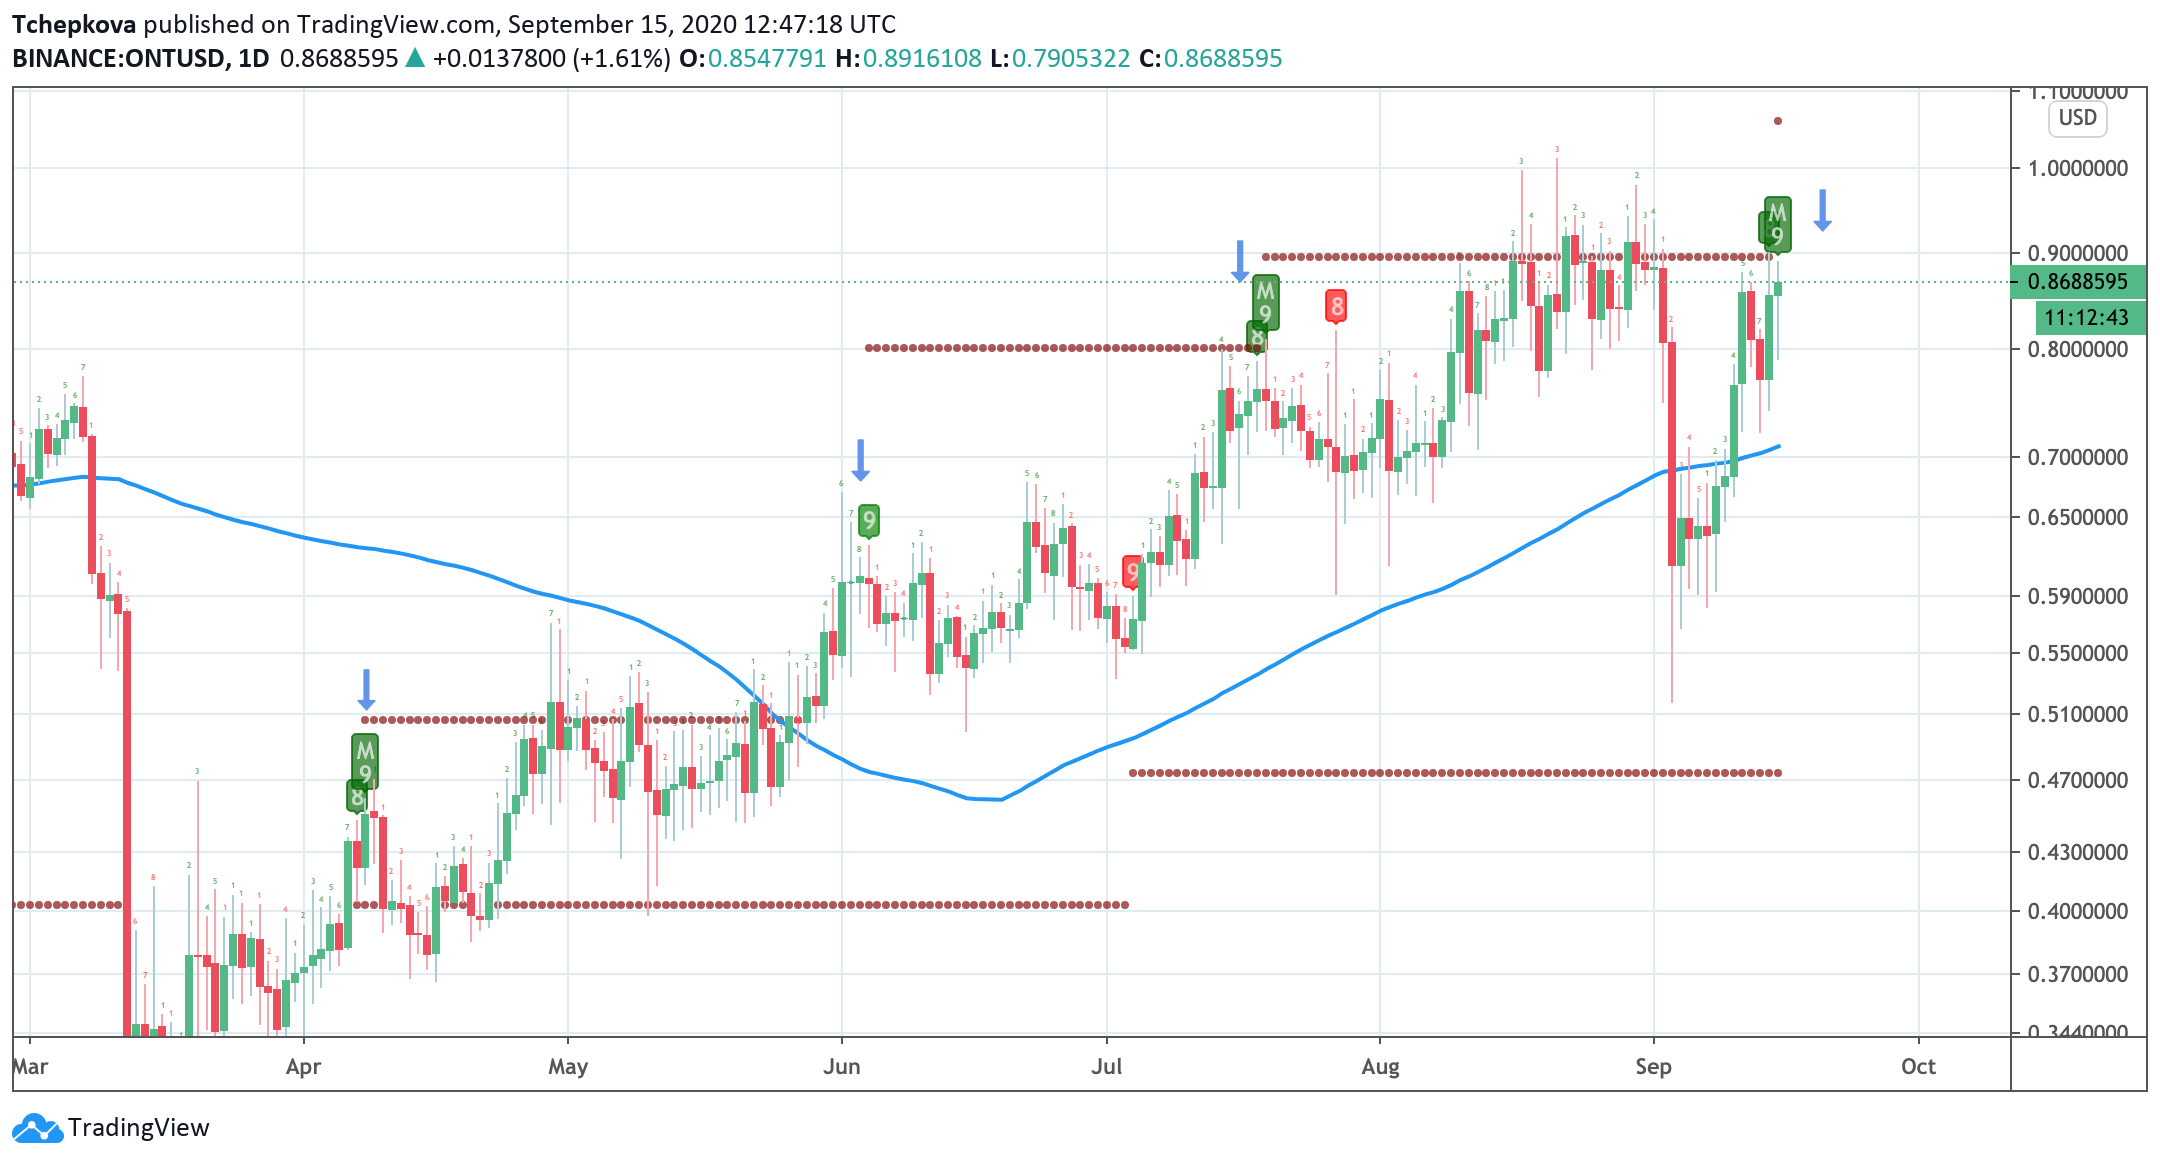
This indicator developed by Tomas DeMark is an efficient tool of technical analysis that can be used to identify the potential reversals of the local trends on candlestick and bar charts. It works well on the cryptocurrency markets, allowing to predict when the trends start weakening. TD Sequential on the daily ONT chart implies that the current bullish trend has reached a turning point. It appears to be a precise technical indicator for ONT as each time it presented a sell signal, prices dropped 17% on average.
ONT/USD daily chart, TD Sequential
Source: TradingView
Also, the price has returned to the lower line of the upside-looking channel ($0.76). A sustainable move below this barrier will confirm the bearish signal of TD Sequential and allow for a downside move with the initial target at $0.715. It is reinforced by the daily SMA50 at $0.71 and followed by a psychological $0.70.
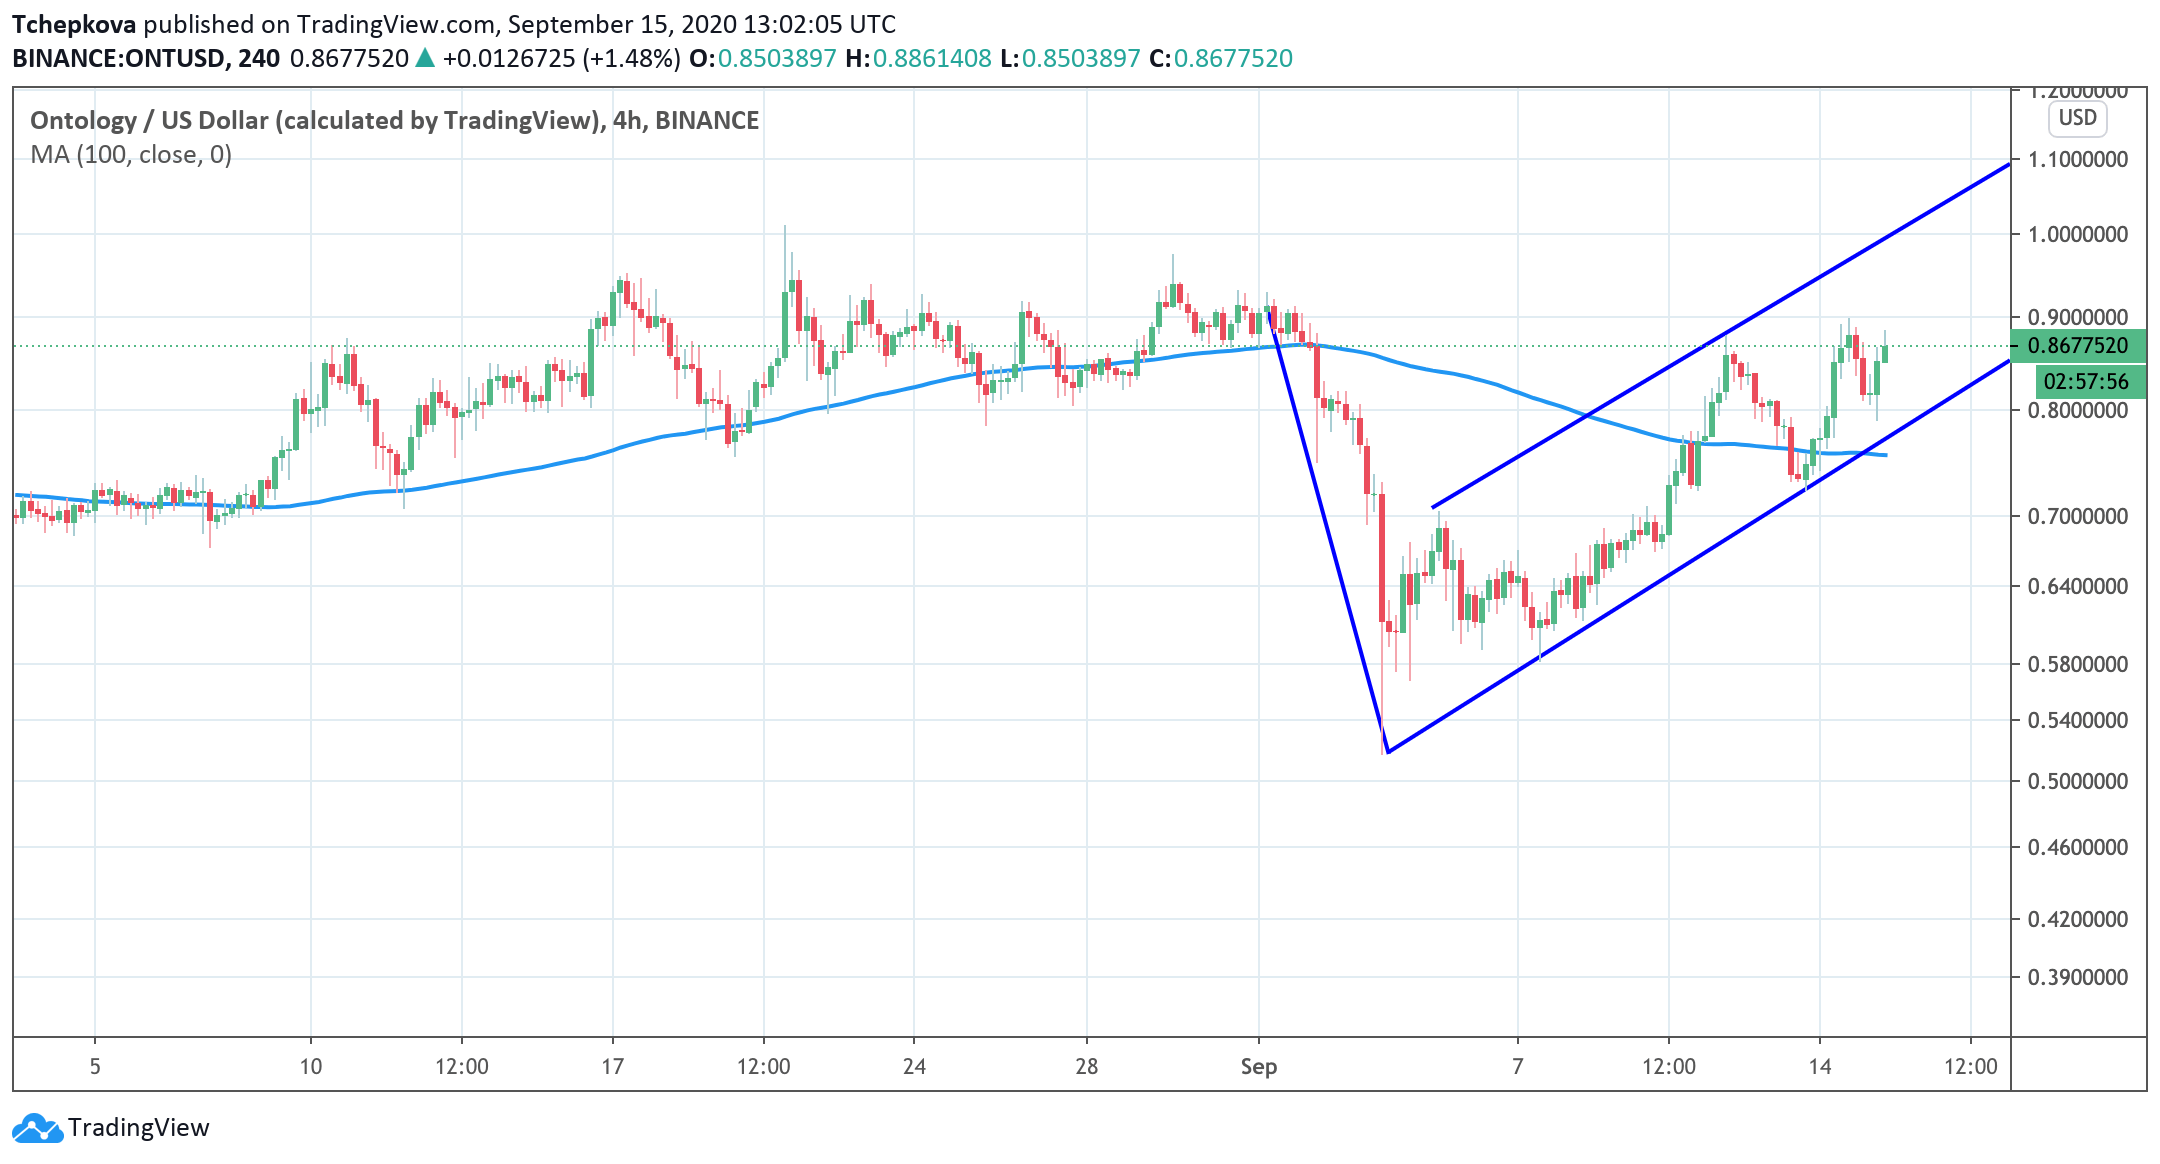
Meanwhile, a bear flag pattern on the 4-hour chart confirms the coin's gloomy outlook, while its lower border at $0.77 serves as short-term support for the price before it extends the decline towards the above-mentioned targets. We will need to see a recovery above $0.90 to mitigate the initial pressure ad allow the price to retest the upper line of the flag formation, which coincides with a critical barrier of $1.00.
ONT/USD 4-hour chart, Flag formation
Source: TradingView
Fundamentals may soften the blow
There has been a lot of things happening with Ontology recently. First of all, the team announced that the credit-based DeFi project Wing launched on ONT blockchain deposited $8 million in ONT. Wing is the recent darling of the DeFi space.
The Genesis Mine Pool came to existence on September 8; however, the Huobi and Binance announced the token's listing as of September 16. The two big cryptocurrency exchanges announced that they would support the staking campaign. Users will have to stake at least 100 ONT for 30 days to get rewards in WING tokens.
Introducing @Wing_Finance $WING on #Binance Launchpool!
— Binance (@binance) September 14, 2020
Farm WING By Staking #BNB, #BUSD & $ONT Tokens
➡️ https://t.co/N33HjBR2oB pic.twitter.com/TzKn8DHeWy
Staking implies that users lock their tokens for a specific time, reducing the circulating supply, and pushing the price higher. However, the effect is usually short-lived as the market tends to buy the rumors and sell the fact. Also, after a while, traders start taking their coins away. That's what happened with TRX after Justin Sun announced his latest SUN project. The coin jumped to $0.053 only to retreat to $0.029 in a matter of days.
To conclude: the technical indicators imply that ONT/USD may be vulnerable to the downside correction with the ultimate target at $0.70. The setups on the daily and 4-hour charts confirm the bearish scenario. However, a positive fundamental background may mitigate the pressure and push the price back towards $1.00. A sustainable move above this psychological barrier will negate the pessimistic forecast.
Author

Tanya Abrosimova
Independent Analyst




