Monero price poised for a downward correction
- Monero price faces rejection at the $181.22 daily resistance level.
- The Relative Strength Index (RSI) and Awesome Oscillator (AO) signal XMR bearish divergence.
- A daily candlestick close above $181.22 would invalidate the bearish thesis.

Monero (XMR) price has encountered resistance at a critical level. The technical outlook suggests a potential short-term correction as momentum indicators signal a bearish divergence.
Monero price set to retest lows
The Monero price failed to close above the $181.22 daily resistance level on Thursday, leading to a short-term correction of roughly 5% from its daily high of $181.23 to a low of $171.40.
This price drop also broke below the ascending trendline, which had previously acted as support, drawn from joining three swing low points from June 8 to 13, as shown in the four-hour chart.
If the $181.22 daily level and the ascending trendline hold as resistance, then Monero's price could decline 3% from its trendline break roughly at $173.47 to its recent low of $167.14 on June 11.
If the bears are aggressive and the overall crypto market outlook is negative, then XMR could break below $167.14, and extend the decline by 9% to retest its low of $152.23 on June 8.
The RSI and the AO indicators support the bearish thesis. The higher close formed on June 13 is not followed by a corresponding high in the RSI for the same period. This development is termed a bearish divergence and often leads to the reversal of the trend or a short-term price drop.
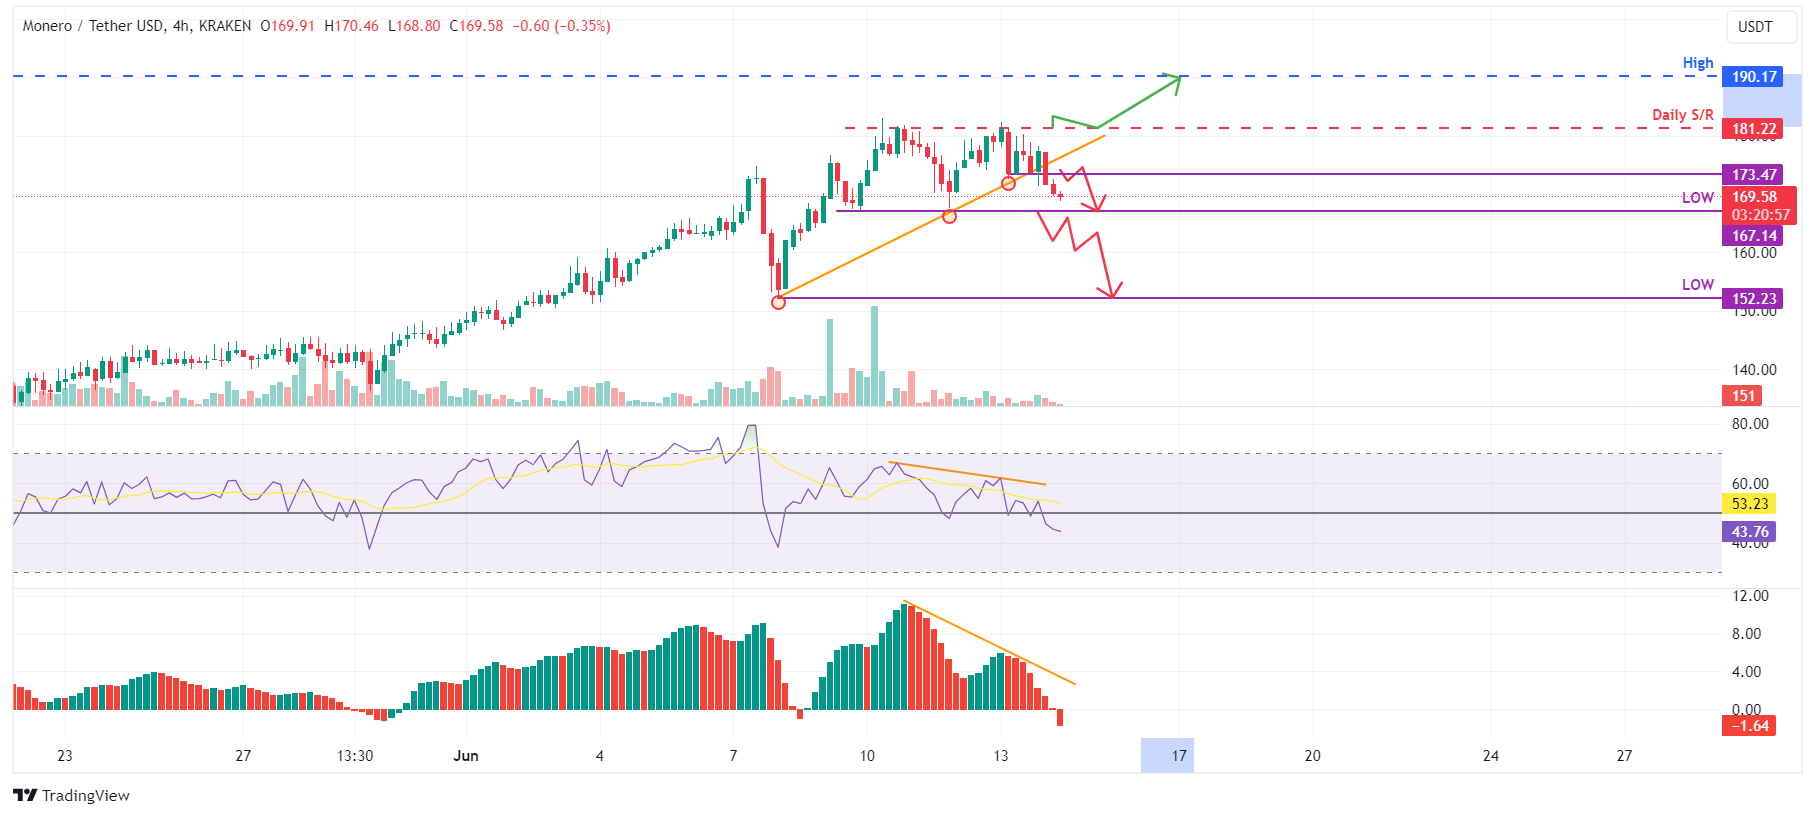
XMR/USDT 4-hour chart
However, if the XMR daily candlestick closes above $181.22, it will produce a higher high in the daily time frame. Such a development would give rise to a bullish market structure. This change in market structure would invalidate the bearish thesis and catalyze a 5% increase in the XMR price to revisit its daily high of $190.17 from June 9.
Author

Manish Chhetri
FXStreet
Manish Chhetri is a crypto specialist with over four years of experience in the cryptocurrency industry.




