Monero Elliott Wave technical analysis [Video]
![Monero Elliott Wave technical analysis [Video]](https://editorial.fxstreet.com/images/Markets/Currencies/Cryptocurrencies/crypto_matrix-637516561995093295.jpg)
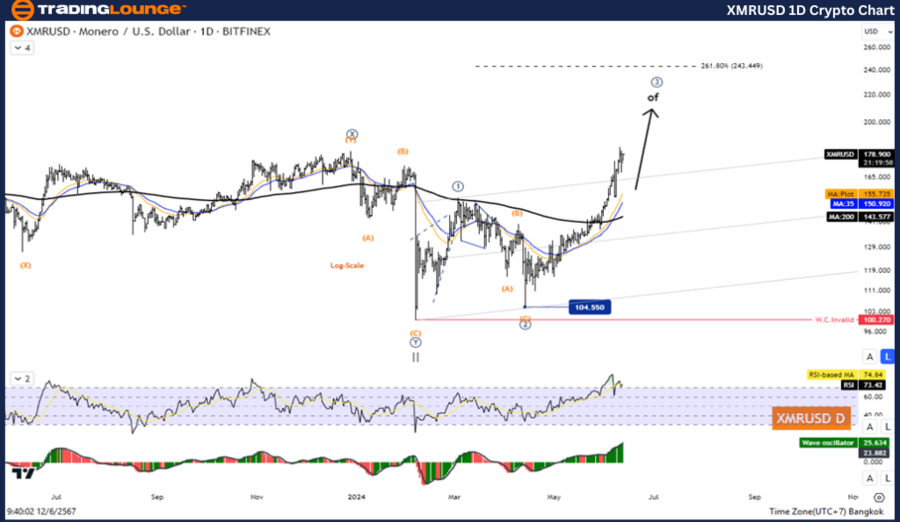
Elliott Wave Analysis TradingLounge Daily Chart,
Monero/ U.S. dollar(XMRUSD).
XMR/USD Elliott Wave technical analysis
Function: Counter Trend.
Mode: Corrective.
Structure: Zigzag.
Position: Wave C.
Direction Next higher Degrees: Wave (2) of Impulse.
Wave Cancel invalid Level: 138.262.
Details: Wave C may end and the price of the five-wave Increase in Wave (3).
Monero/US Dollar (XMRUSD)Trading Strategy:
Overall, Monero remains in an uptrend. which the rise of the third wave It is likely to test the 243.44 level, so look for opportunities to join the trend from the correction.
Monero/US Dollar(XMRUSD)Technical Indicators: The price is below the MA200 indicating an Uptrend, The Wave Oscillator is a Bullish Momentum.
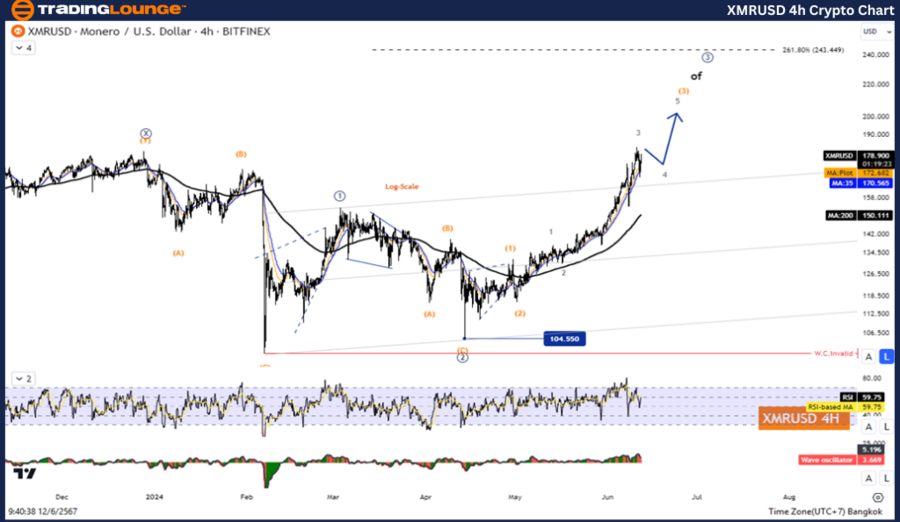
Elliott Wave Analysis TradingLounge H4 Chart.
Monero/ U.S. dollar(XMRUSD).
XMR/USD Elliott Wave technical analysis
Function: Counter Trend.
Mode: Corrective.
Structure: Zigzag.
Position: Wave C.
Direction next higher degrees: Wave (2) of Impulse.
Wave cancel invalid level: 138.262.
Details: Wave C may end and the price of the five-wave Increase in Wave (3).
Monero/U.S. dollar(XMRUSD)Trading Strategy:
Overall, Monero remains in an uptrend. which the rise of the third wave It is likely to test the 243.44 level, so look for opportunities to join the trend from the correction.
Monero/ U.S. dollar(XMRUSD)Technical Indicators: The price is below the MA200 indicating an Uptrend, The Wave Oscillator is a Bullish Momentum.
Technical analyst: Kittiampon Somboonsod.
XMR/USD Elliott Wave technical analysis [Video]
Author

Peter Mathers
TradingLounge
Peter Mathers started actively trading in 1982. He began his career at Hoei and Shoin, a Japanese futures trading company.


