- Pepe price encounters resistance from a descending trendline.
- BOOK OF MEME price finds support at the weekly level of $0.00944.
- TRUMP price finds support along an ascending trendline.
Pepe (PEPE) price has encountered resistance at a critical level, whereas Trump (MAGA) and Book of Meme (BOME) are testing crucial support levels. The technical outlook suggests potential short-term corrections for PEPE and BOME, while MAGA appears poised for a rally.
Pepe price eyes for a short-term fall
Pepe price currently faces resistance by a descending trendline drawn from joining three swing high points from the end of May to mid-June, as shown in the four-hour chart.
If this trendline holds as resistance, then PEPE could crash around 14% from its current trading price of $0.0000119 to $0.0000106, the 50% price retracement of the $0.0000039 to $0.0000172 up move.
The Relative Strength Index (RSI) and the Awesome Oscillator (AO) on the four-hour chart support this bearish scenario, as both indicators are below their respective mean levels of 50 and 0.
This suggests the exhaustion among bulls and continued momentum favoring bears, potentially leading to a further decline in PEPE's price.
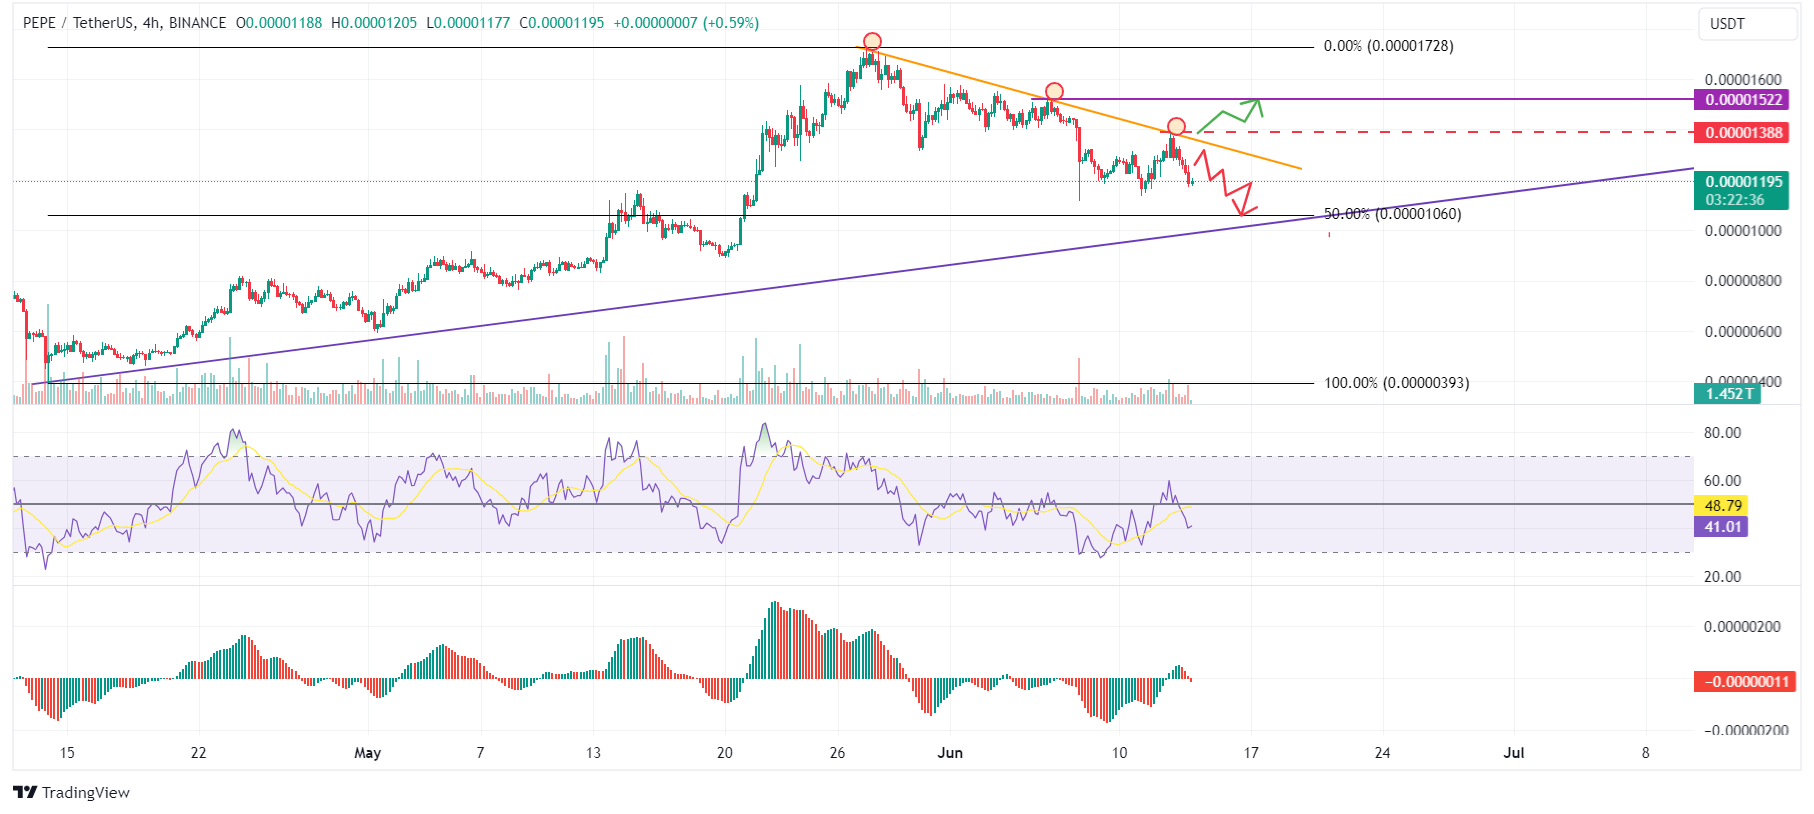
PEPE/USDT 4-hour chart
On the other hand, if Pepe’s price closes above $0.0000138, it would invalidate the bearish thesis by producing a higher high in the daily time frame, leading PEPE to rally 10% and hitting the previous daily high of $0.0000152 on June 6.
BOOK OF MEME price set to retest lows
BOME price current stability hinges on the $0.00944 weekly support, but a breach below could trigger a 13% plunge to revisit its May 1 low of $0.00826.
The Relative Strength Index (RSI) and the Awesome Oscillator (AO) on the four-hour chart support this bearish scenario, as both indicators are below their respective mean levels of 50 and 0.
This suggests the exhaustion among bulls and continued momentum favoring bears, potentially leading to a further decline in BOME's price.
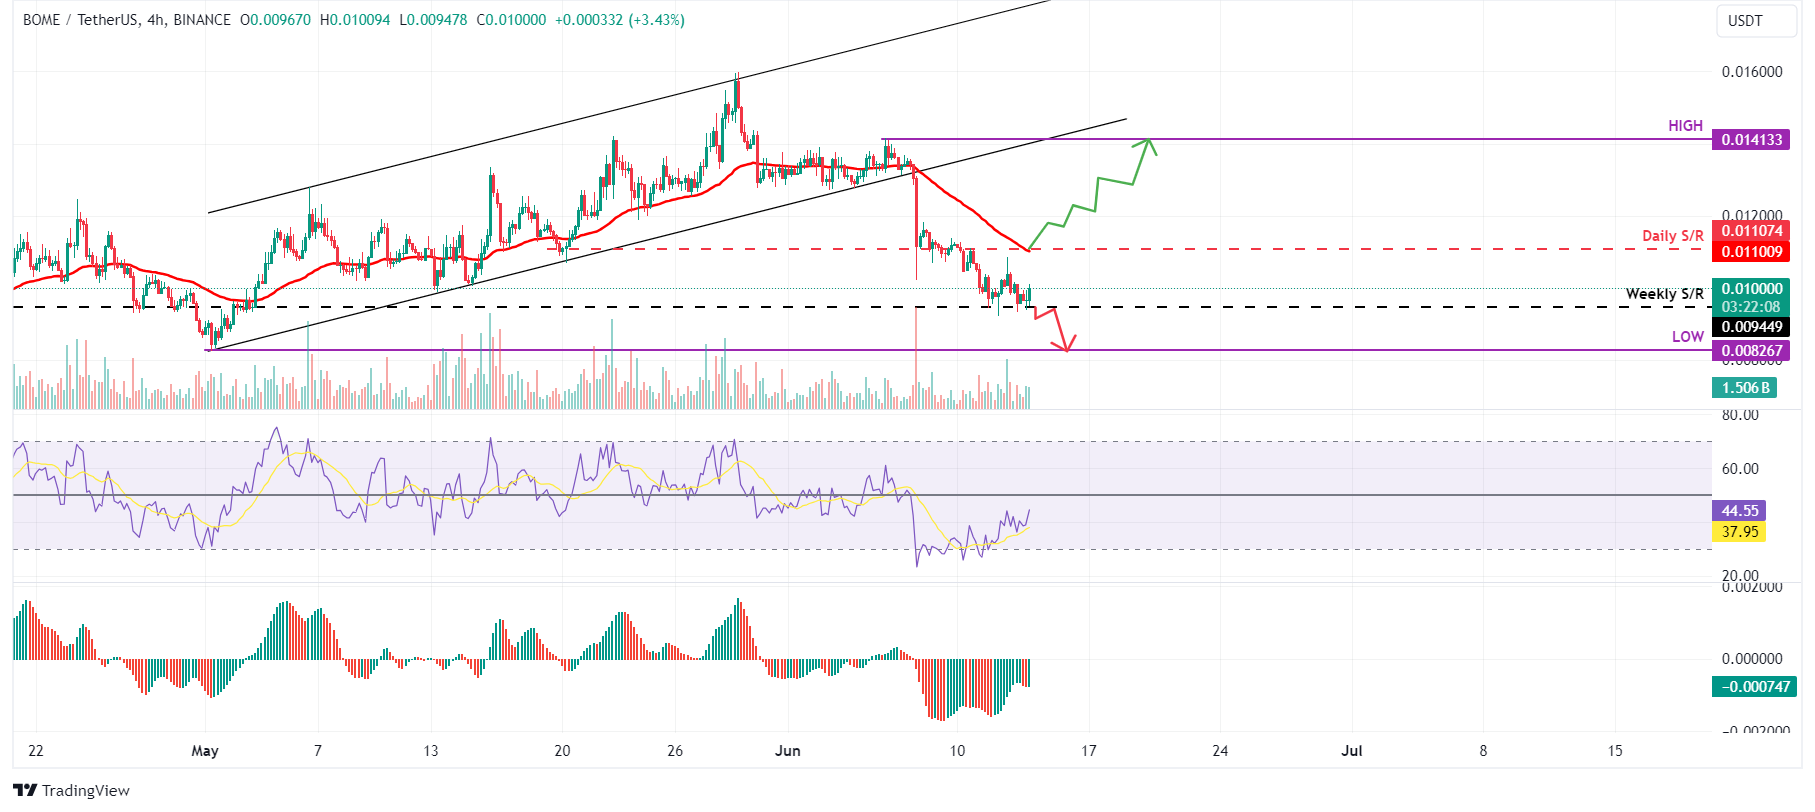
BOME/USDT 4-hour chart
However, if the BOME daily candlestick closes above the $0.0111 daily resistance level and flips it in support, and the RSI and AO surge above their mean levels of 50 and 0, then a pivotal market shift from bearish to bullish could transpire.
This structural change would be marked by BOME forming a higher high in the daily timeframe. In such an event, BOME could potentially rally by 27%, aiming to retest its June 6 high of $0.014133.
TRUMP price shows potential
MAGA price (TRUMP) finds support around an ascending trendline drawn from joining multiple swing low points from May to June, as shown in the four-hour chart. If this support holds and TRUMP’s price closes above the $14.127 daily resistance level, then it could rally 25% to tag the daily high of $17.79 on June 1.
The Relative Strength Index (RSI) and the Awesome Oscillator (AO) on the four-hour chart support this bullish outlook by both being above the mean levels of 50 and 0, indicating that bulls still have steam to push TRUMP's price higher.
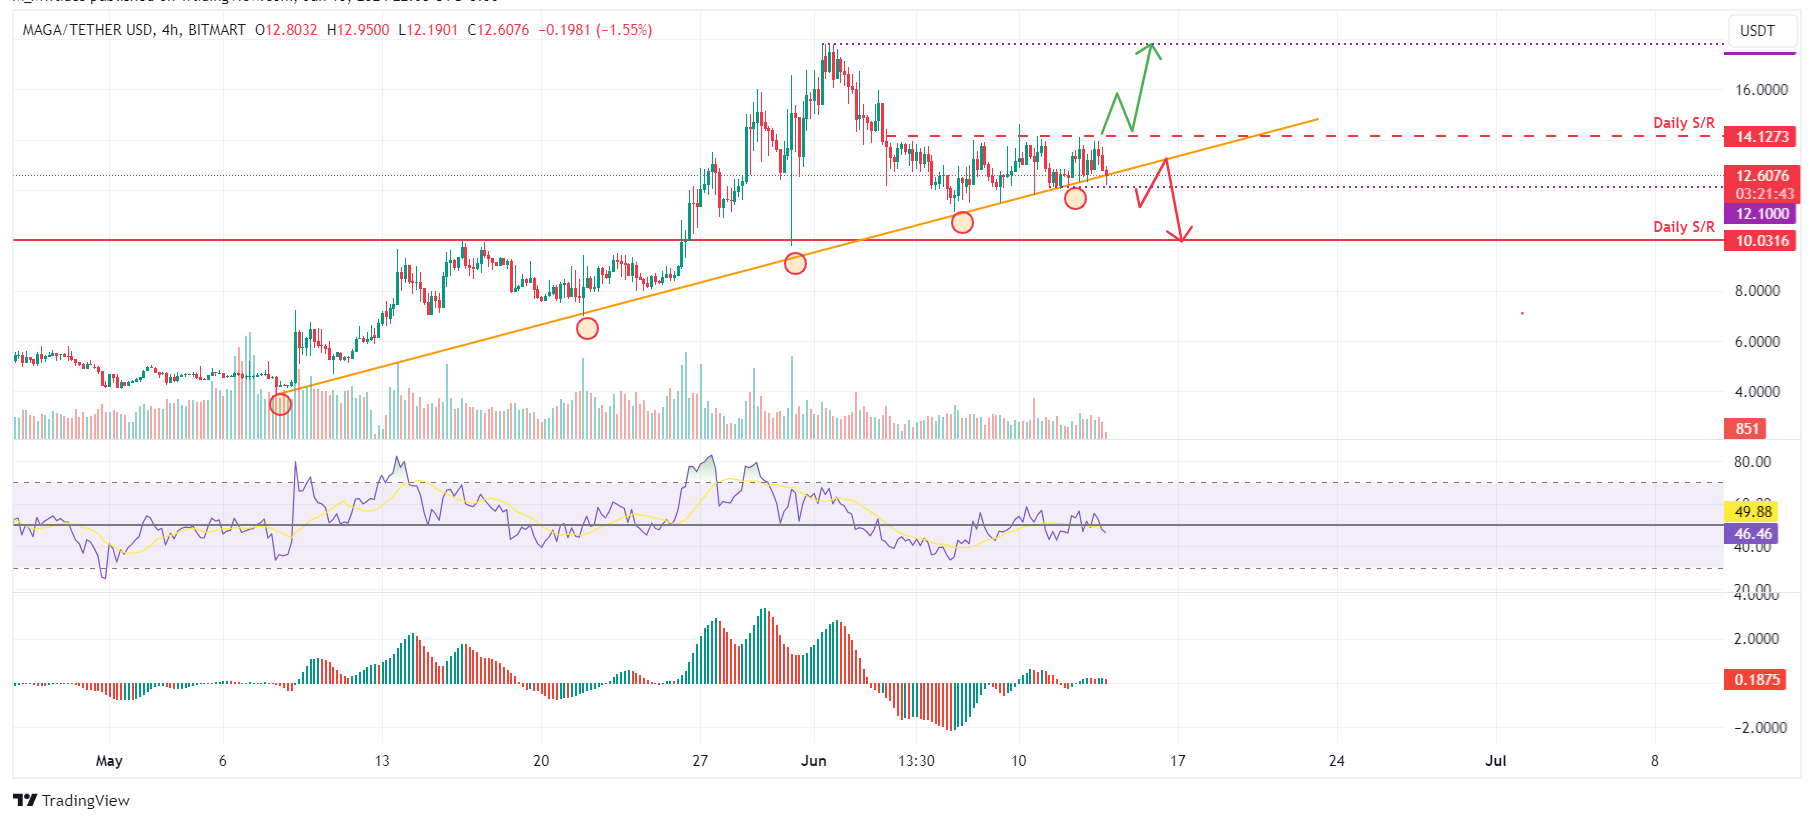
TRUMP/USDT 4-hour chart
On the other hand, if MAGA's daily candlestick breaks below the trendline and closes below the $12.10 level, it would produce a lower low and signal a break in the market structure. This move would invalidate the aforementioned bullish thesis, potentially triggering a 17% crash to the daily support level of $10.03.
Information on these pages contains forward-looking statements that involve risks and uncertainties. Markets and instruments profiled on this page are for informational purposes only and should not in any way come across as a recommendation to buy or sell in these assets. You should do your own thorough research before making any investment decisions. FXStreet does not in any way guarantee that this information is free from mistakes, errors, or material misstatements. It also does not guarantee that this information is of a timely nature. Investing in Open Markets involves a great deal of risk, including the loss of all or a portion of your investment, as well as emotional distress. All risks, losses and costs associated with investing, including total loss of principal, are your responsibility. The views and opinions expressed in this article are those of the authors and do not necessarily reflect the official policy or position of FXStreet nor its advertisers. The author will not be held responsible for information that is found at the end of links posted on this page.
If not otherwise explicitly mentioned in the body of the article, at the time of writing, the author has no position in any stock mentioned in this article and no business relationship with any company mentioned. The author has not received compensation for writing this article, other than from FXStreet.
FXStreet and the author do not provide personalized recommendations. The author makes no representations as to the accuracy, completeness, or suitability of this information. FXStreet and the author will not be liable for any errors, omissions or any losses, injuries or damages arising from this information and its display or use. Errors and omissions excepted.
The author and FXStreet are not registered investment advisors and nothing in this article is intended to be investment advice.
Recommended Content
Editors’ Picks

Crypto market wipes out $1 billion in liquidation as Asian markets bleed red
The crypto markets continue to decline on Monday, with Bitcoin (BTC) falling below $78,000. The Asian markets also traded in the red, with Japan’s stock market extending losses to 8.5%, its lowest level since October 2023.

XRP Price Prediction: XRP hangs on a loose thread, deeper correction below $2 impending?
Ripple (XRP) is extending losses below the previous week’s critical level at $2.00, as United States (US) President Donald Trump doubled down on tariffs, stressing that America must solve the trade deficit before making a deal.

Top 3 Price Prediction Bitcoin, Ethereum, Ripple: BTC and XRP head to yearly lows while ETH hits two-year bottom
Bitcoin (BTC) price hovers around $78,600 on Monday after falling nearly 5% the previous week. Ethereum (ETH) and Ripple (XRP) also followed in BTC’s footsteps and declined 13% and 10%, respectively, in the previous week.

Bitcoin could be the winner in the ongoing trade war after showing signs of decoupling from stocks
Bitcoin (BTC) traded above $84,000 on Friday, showing strength despite the stock market experiencing significant declines. The market reaction stems from United States (US) President Donald Trump's clash with the Federal Reserve Chairman Jerome Powell over interest rate decisions.

Bitcoin Weekly Forecast: Tariff ‘Liberation Day’ sparks liquidation in crypto market
Bitcoin (BTC) price remains under selling pressure and trades near $84,000 when writing on Friday after a rejection from a key resistance level earlier this week.

The Best brokers to trade EUR/USD
SPONSORED Discover the top brokers for trading EUR/USD in 2025. Our list features brokers with competitive spreads, fast execution, and powerful platforms. Whether you're a beginner or an expert, find the right partner to navigate the dynamic Forex market.