Is Dogecoin ready for a rally?
- Dogecoin price finds support around the descending trendline breakout level, eyeing a rally ahead.
- DOGE’s daily active addresses spiked to the highest level since early April.
- A daily candlestick close below $0.098 would invalidate the bullish thesis.

Dogecoin price extends gains on Monday after retesting its support level last week. This rise is supported by DOGE’s daily active addresses, an on-chain metric that has spiked to the highest level since early April. This spike indicates greater blockchain usage and suggests a rise in Dogecoin’s price ahead.
Dogecoin price shows potential for a rally
Dogecoin price broke above a descending trendline (drawn by connecting multiple highs from the end of May) on September 24 and rallied over 18% in the next four days. Since then, DOGE retraced all its recent gains after facing resistance around its daily level of $0.128 on September 29. However, on Thursday, it found support around the previous trendline breakout level of $0.102 and rose 6.6% until Sunday. At the time of writing on Monday, it continues to trade higher around $0.114.
If the trendline breakout level around $0.102 continues to hold as support, DOGE could rally 12% from its current trading level to its daily resistance level of $0.128.
The daily chart’s Relative Strength Index (RSI) indicator has flipped above its neutral level of 50, indicating rising bullish momentum. Moreover, the Moving Average Convergence Divergence (MACD) is about to show a bullish crossover (with the MACD line (blue line in the chart below) pointing to cross above the signal line (yellow line), giving a buy signal), which indicates bullish momentum. However, traders should be cautious as this crossover still needs to be done.
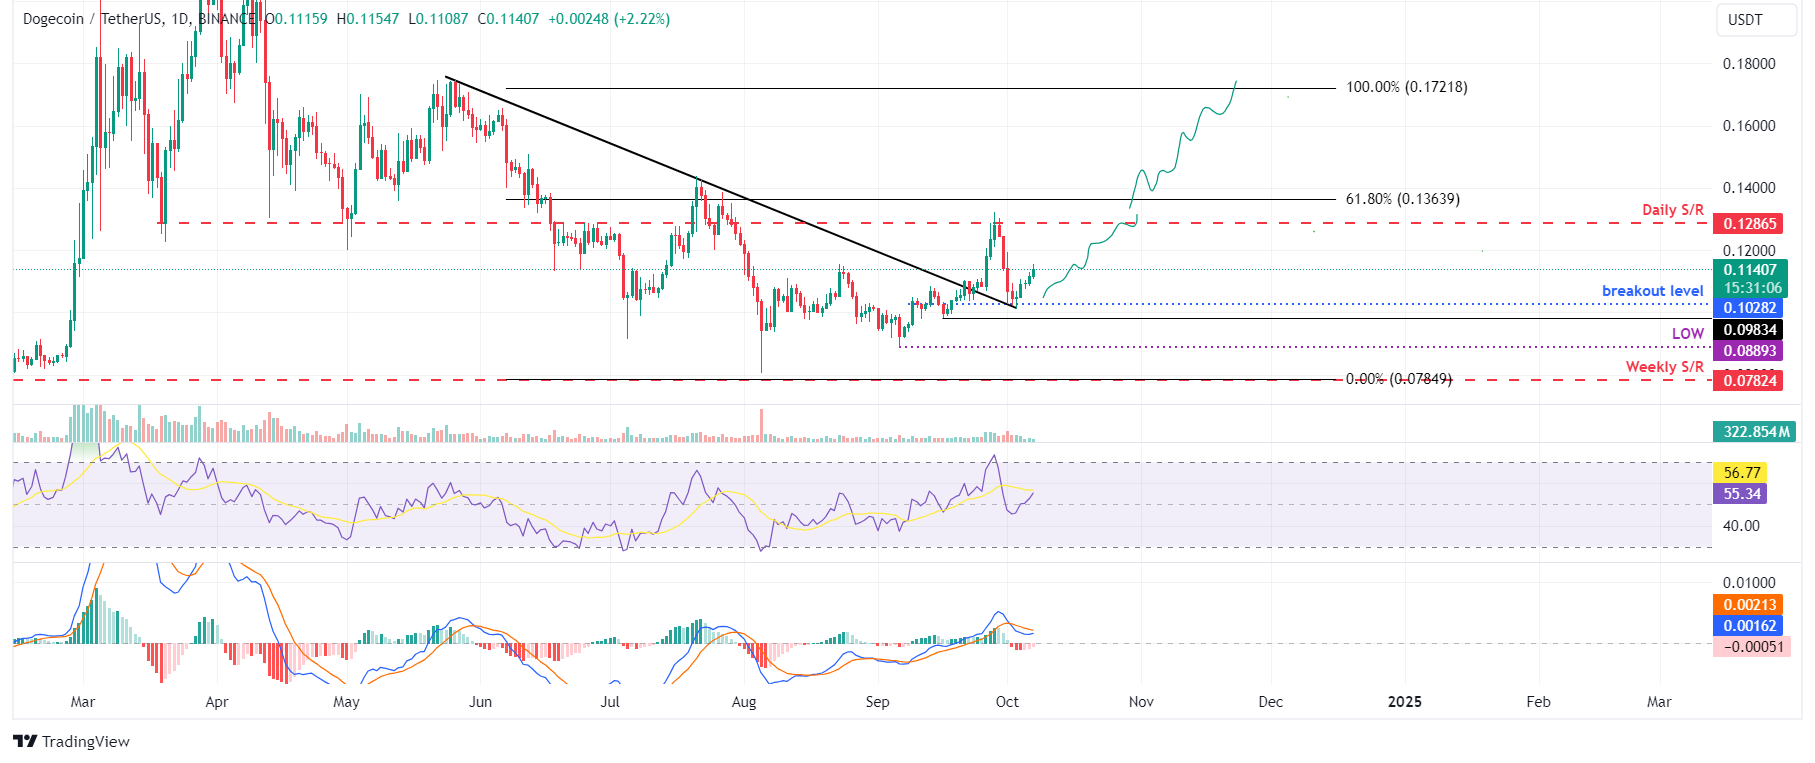
DOGE/USDT daily chart
IntoTheBlock’s In/Out of the Money Around Price (IOMAP) further supports the bullish outlook. Nearly 32,770 addresses accumulated 35.48 billion DOGE tokens at an average price of $0.112. These addresses bought Dogecoin between $0.110 and $0.114, making it a key support zone.
From a technical analysis perspective, the $0.110 level roughly coincides with the IOMAP findings, making this zone a key reversal level to watch.
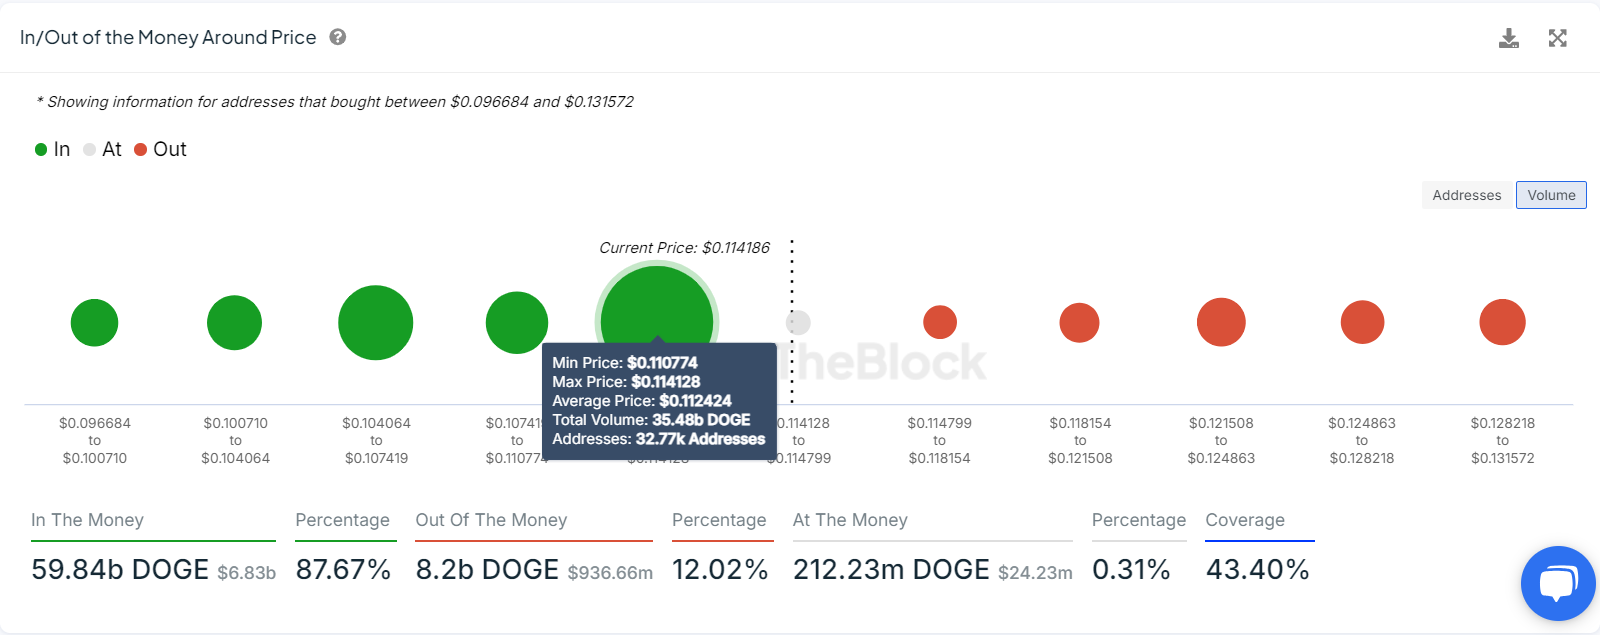
DOGE IOMAP chart. Source: IntoTheBlock
Santiment’s Daily Active Addresses index, which tracks network activity over time, also paints a bullish outlook for Dogecoin. A rise in the metric signals greater blockchain usage, while declining addresses point to lower demand for the network.
In DOGE’s case, Daily Active Addresses spiked from 57,848 on September 30 to 81,689 on October 1, the highest level since early April. This indicates that demand for DOGE’s blockchain usage is increasing, which bodes well for Dogecoin’s price.
%20[12.23.24,%2007%20Oct,%202024]-638638884553048698.png)
DOGE daily active addresses chart. Source: Santiment
Even though on-chain metrics and technical analysis support the bullish outlook, if Doge’s daily candlestick closes below $0.098, the bullish thesis would be invalidated by creating a lower low on the daily chart. This development could see Dogecoin’s price decline by 10% to retest its September 6 low of $0.088.
Author

Manish Chhetri
FXStreet
Manish Chhetri is a crypto specialist with over four years of experience in the cryptocurrency industry.


