Dogecoin Elliott Wave technical analysis [Video]
![Dogecoin Elliott Wave technical analysis [Video]](https://editorial.fxstreet.com/images/Markets/Currencies/Cryptocurrencies/Dogecoin/dogecoin-200x200-637483778649728159.jpg)
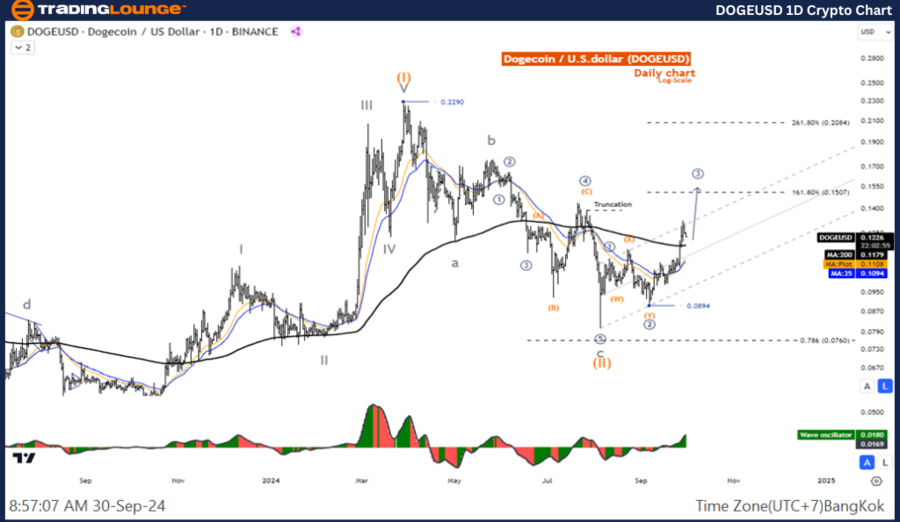
Elliott Wave Analysis TradingLounge Daily Chart.
DOGE/USD Elliott Wave technical analysis
Function: Follow Trend.
Mode: Motive.
Structure: Impulse.
Position: Wave ((3)).
Direction next higher degrees: Wave I of Impulse.
Details: Wave ((3)) is likely to test the 161.8% level of wave ((1)).
Dogecoin/ US dollar (DOGEUSD) trading strategy: It looks like the wave IV correction is complete and the price is still likely to move up. Look for an opportunity to join the wave V uptrend.
Dogecoin/ US dollar (DOGEUSD) technical indicators: The price is above the MA200 indicating an uptrend, The Wave Oscillator is a Bearish Momentum.
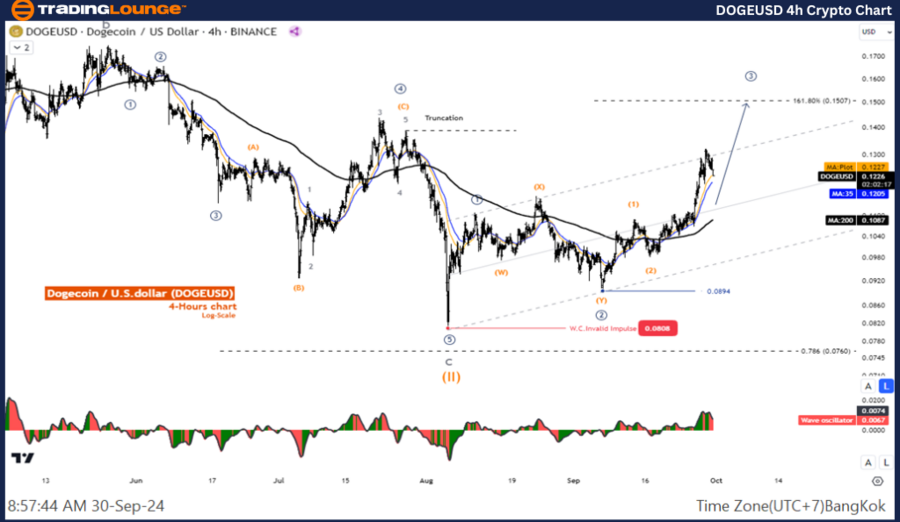
DOGE/USD Elliott Wave technical analysis
Function: Follow Trend.
Mode: Motive.
Structure: Impulse.
Position: Wave ((3)).
Direction next higher degrees: Wave I of Impulse.
Details: Wave ((3)) is likely to test the 161.8% level of wave ((1)).
Dogecoin/ US dollar (DOGEUSD) Trading Strategy: It looks like the wave (2) correction is complete and the price is still likely to move up. Look for an opportunity to join the wave (3) uptrend.
Dogecoin/ US dollar (DOGEUSD) Technical Indicators: The price is above the MA200 indicating an uptrend, The Wave Oscillator is a Bearish Momentum.
Dogecoin Elliott Wave technical analysis [Video]
Author

Peter Mathers
TradingLounge
Peter Mathers started actively trading in 1982. He began his career at Hoei and Shoin, a Japanese futures trading company.


