Four Bitcoin on-chain metrics rise to all-time highs suggesting the bull run has just begun
- Bitcoin price correction might be nearing an end as several on-chain metrics hint that the bull run is just getting started.
- The downswing allowed sidelined investors to get back into the market, creating an opportunity for a new leg up.

Bitcoin price retraced more than 20% after hitting a new all-time high of $41,986 on January 8. While the chances of further losses remain high, it might set the conditions for a new influx of capital that ignites a new uptrend.
Bitcoin on-chain indicators rise to record highs
Number of Active Addresses on the Bitcoin network considers how many tokens are being transacted daily. A higher address count indicates increased adoption and investors’ activity, both of which are positive developments for the underlying asset’s price.
In this case, Bitcoin’s Active Addresses hit a new all-time high of 1.34 million after jumping more than 8.80% in a single day.
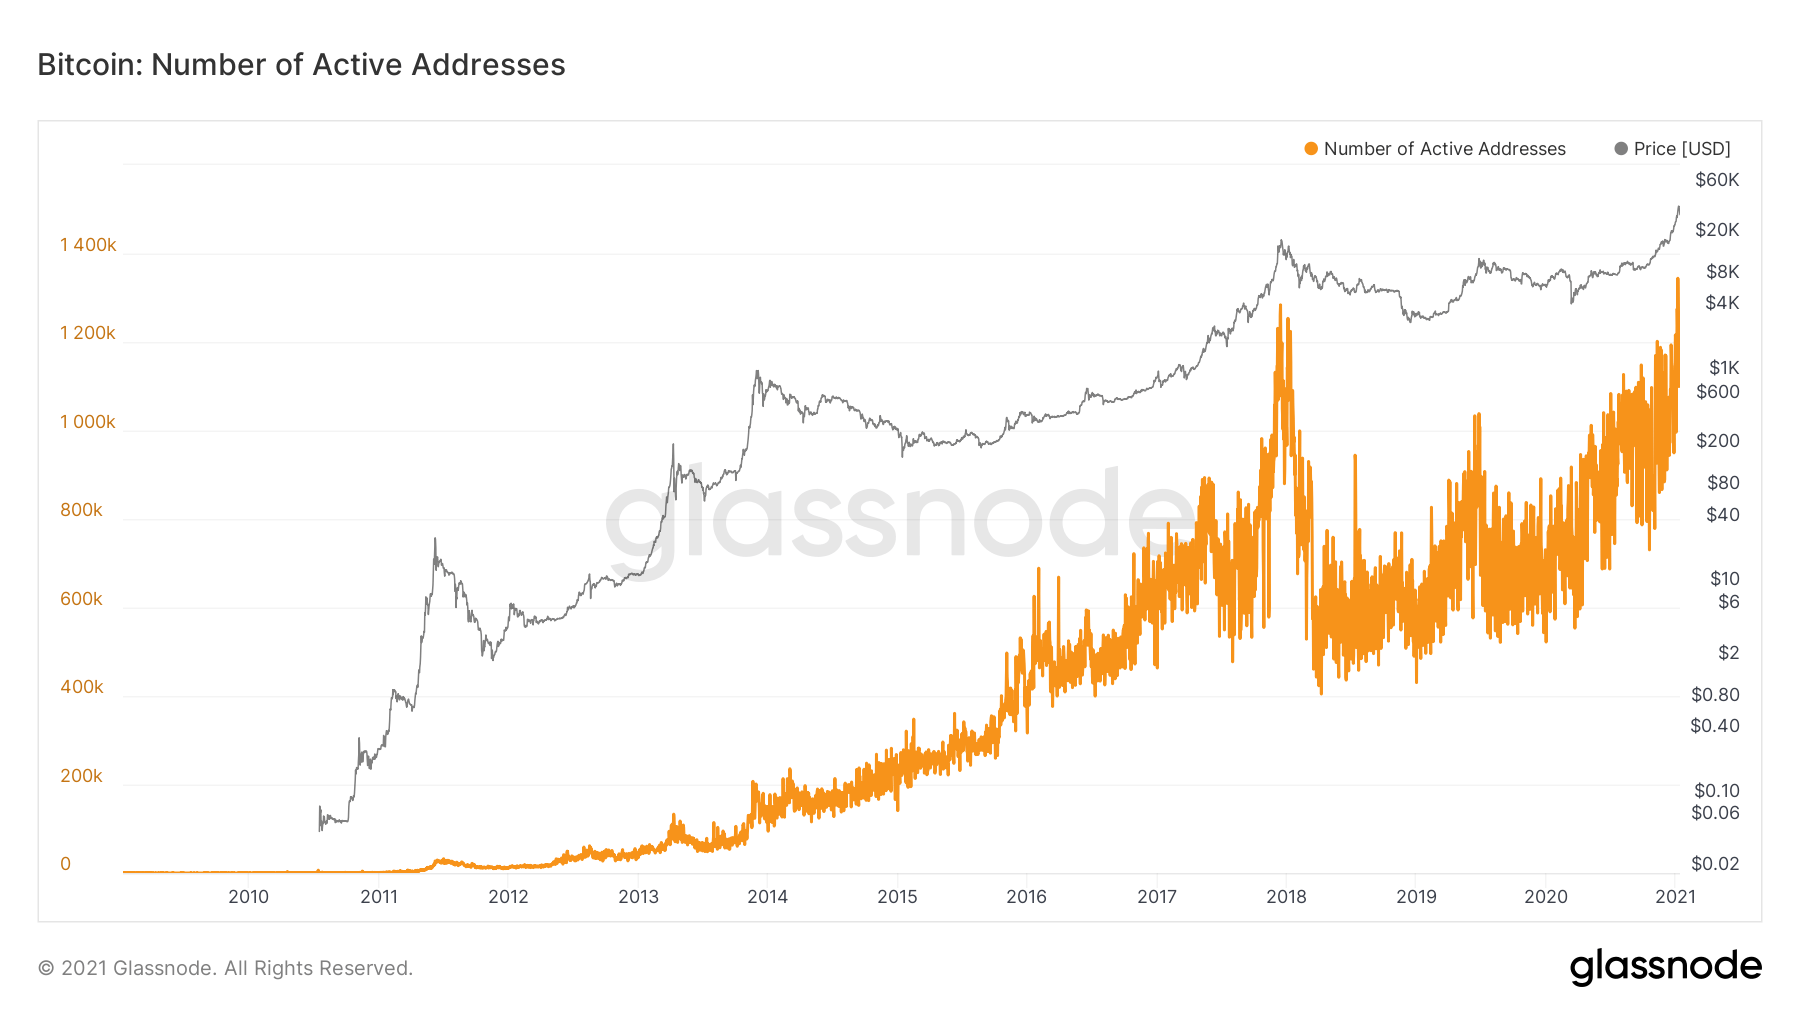
Bitcoin Active Addresses chart
Number of Active Entities is defined by Glassnode as “a cluster of addresses that are controlled by the same network’s entity.” Hence, it is an on-chain metric that considers the number of wallets that are active either as a sender or as a receiver.
At press time, the number of active entities on Bitcoin’s protocol peaked at 510,000. This represents a 25% increase from its previous all-time high in 2017, indicating that investors are actively using Bitcoin’s blockchain.
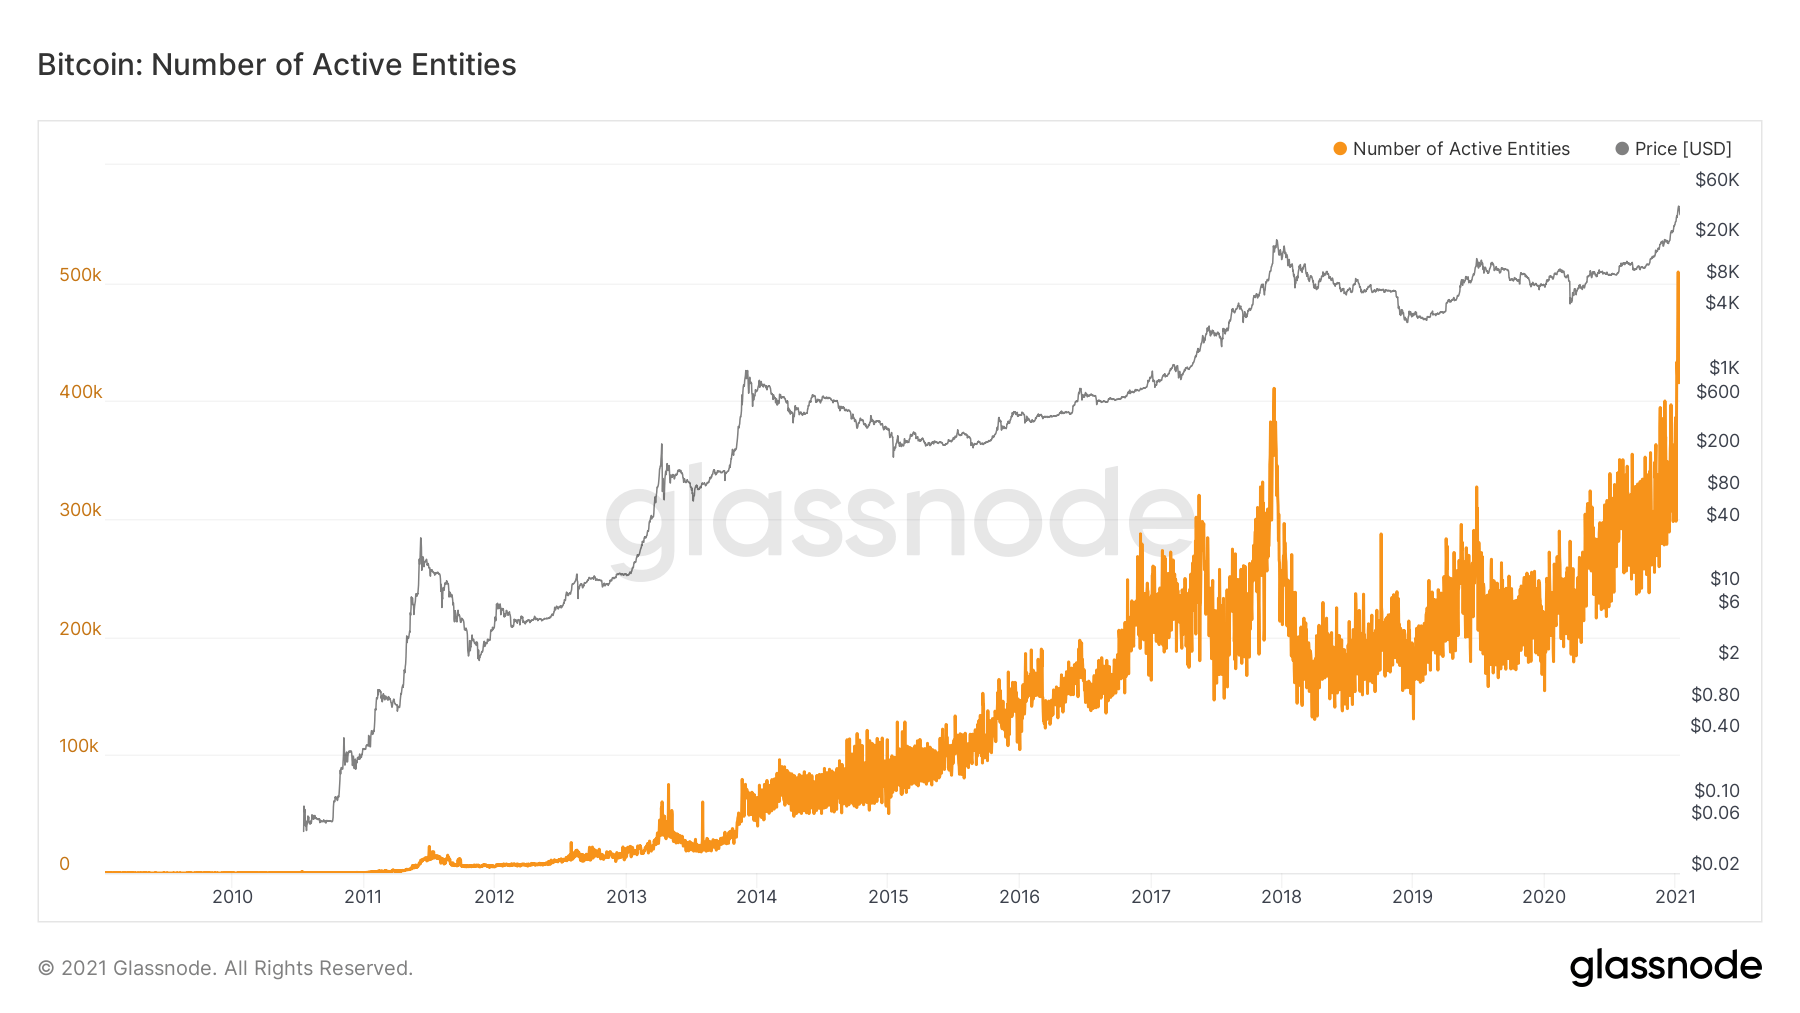
Bitcoin Number of Active Entities chart
Mining Difficulty is an implementation that governs the time required to mine a block based on the total estimated mining power. A surge in this gauge indicates that it will take more time and computing power to mine the same number of blocks. Such increases in mining difficulty only happen when Bitcoin price appreciates or is anticipated to trend higher, attracting more miners.
The recent adjustment at block 665,280 is an 11% increase from the last adjustment seen on December 27. The upswing in mining difficulty to record highs is apparent considering the massive uptick in miner revenue due to a parabolic advance Bitcoin price went through since Q3 2020.
With mining manufacturers being sold out of mining equipment, it only suggests that the mining pools plan to capitalize on the ongoing bull run.
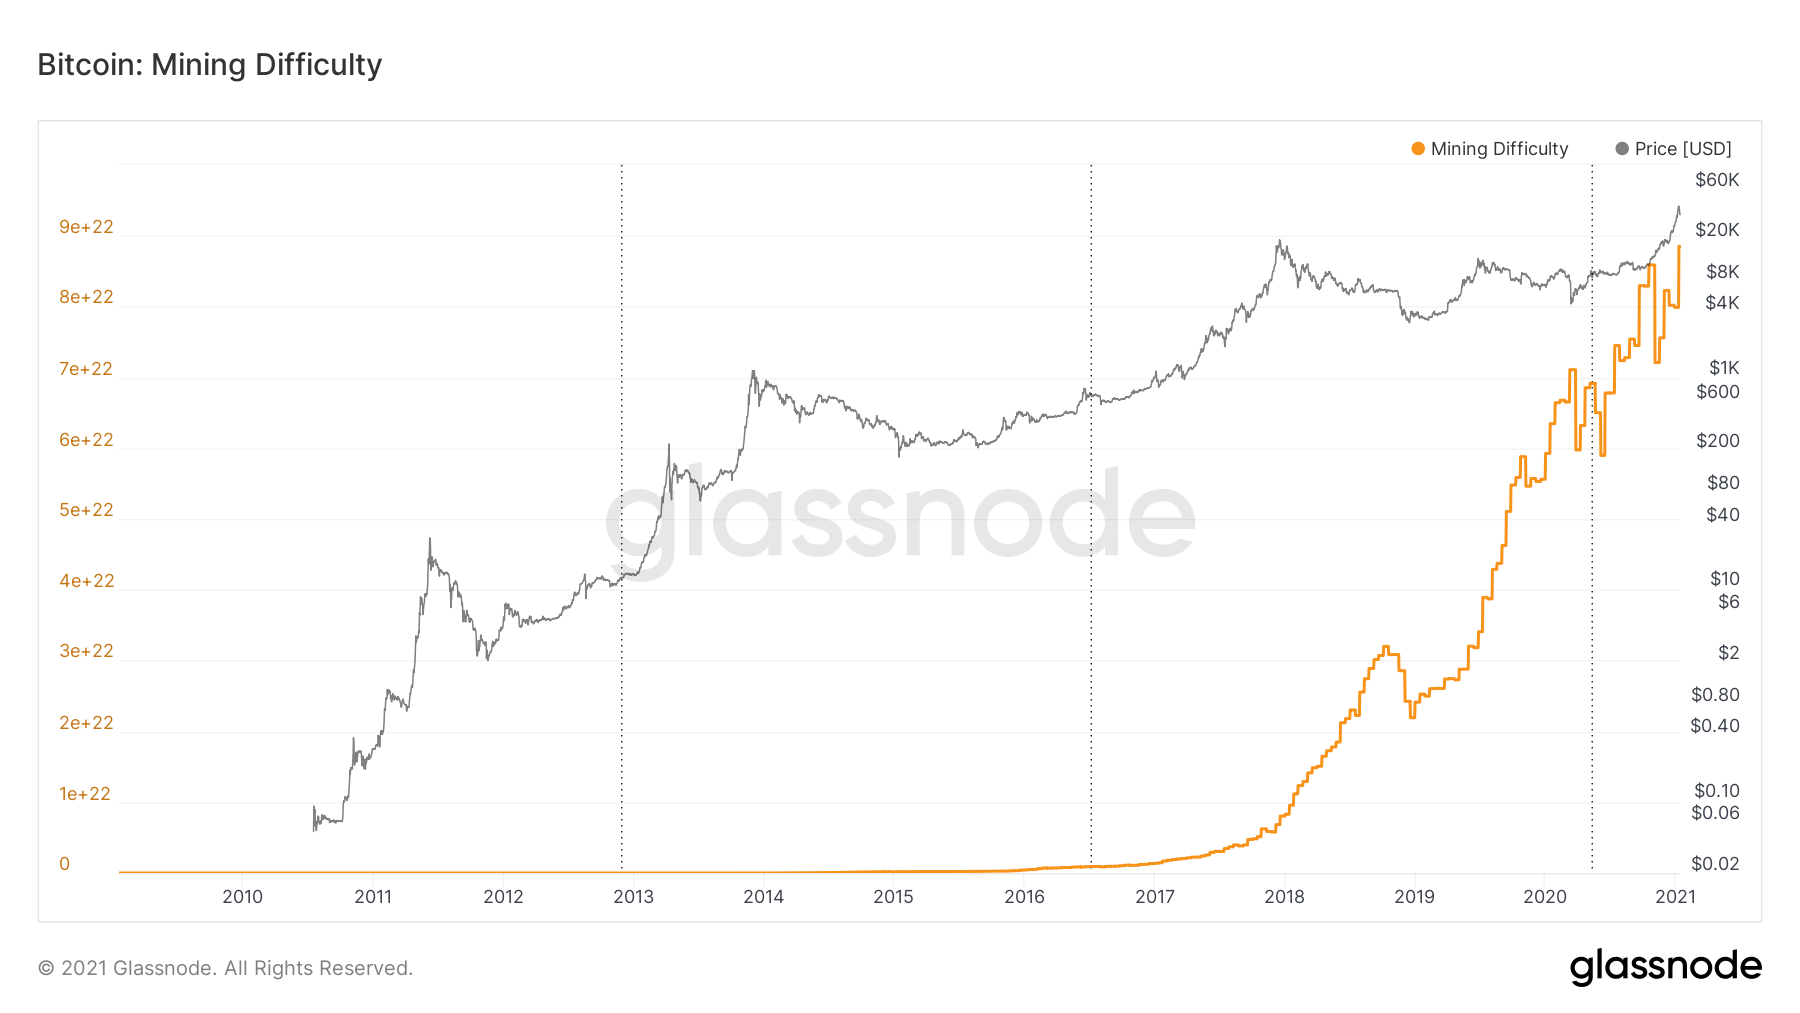
Bitcoin Mining Difficulty chart
Bitcoin’s Hash Rate is another on-chain metric that is closely connected with the mining difficulty. In simple terms, the hash rate is the estimated measure of the total computing power or the number of hashes produced per second by miners. A higher hash rate suggests an increased miner activity, which eventually leads to greater mining difficulty.
The hash rate has seen a considerable increase after Black Thursday’s market crash in March 2020. However, Bitcoin’s current hash rate hit a new high of $165 million TH/s.
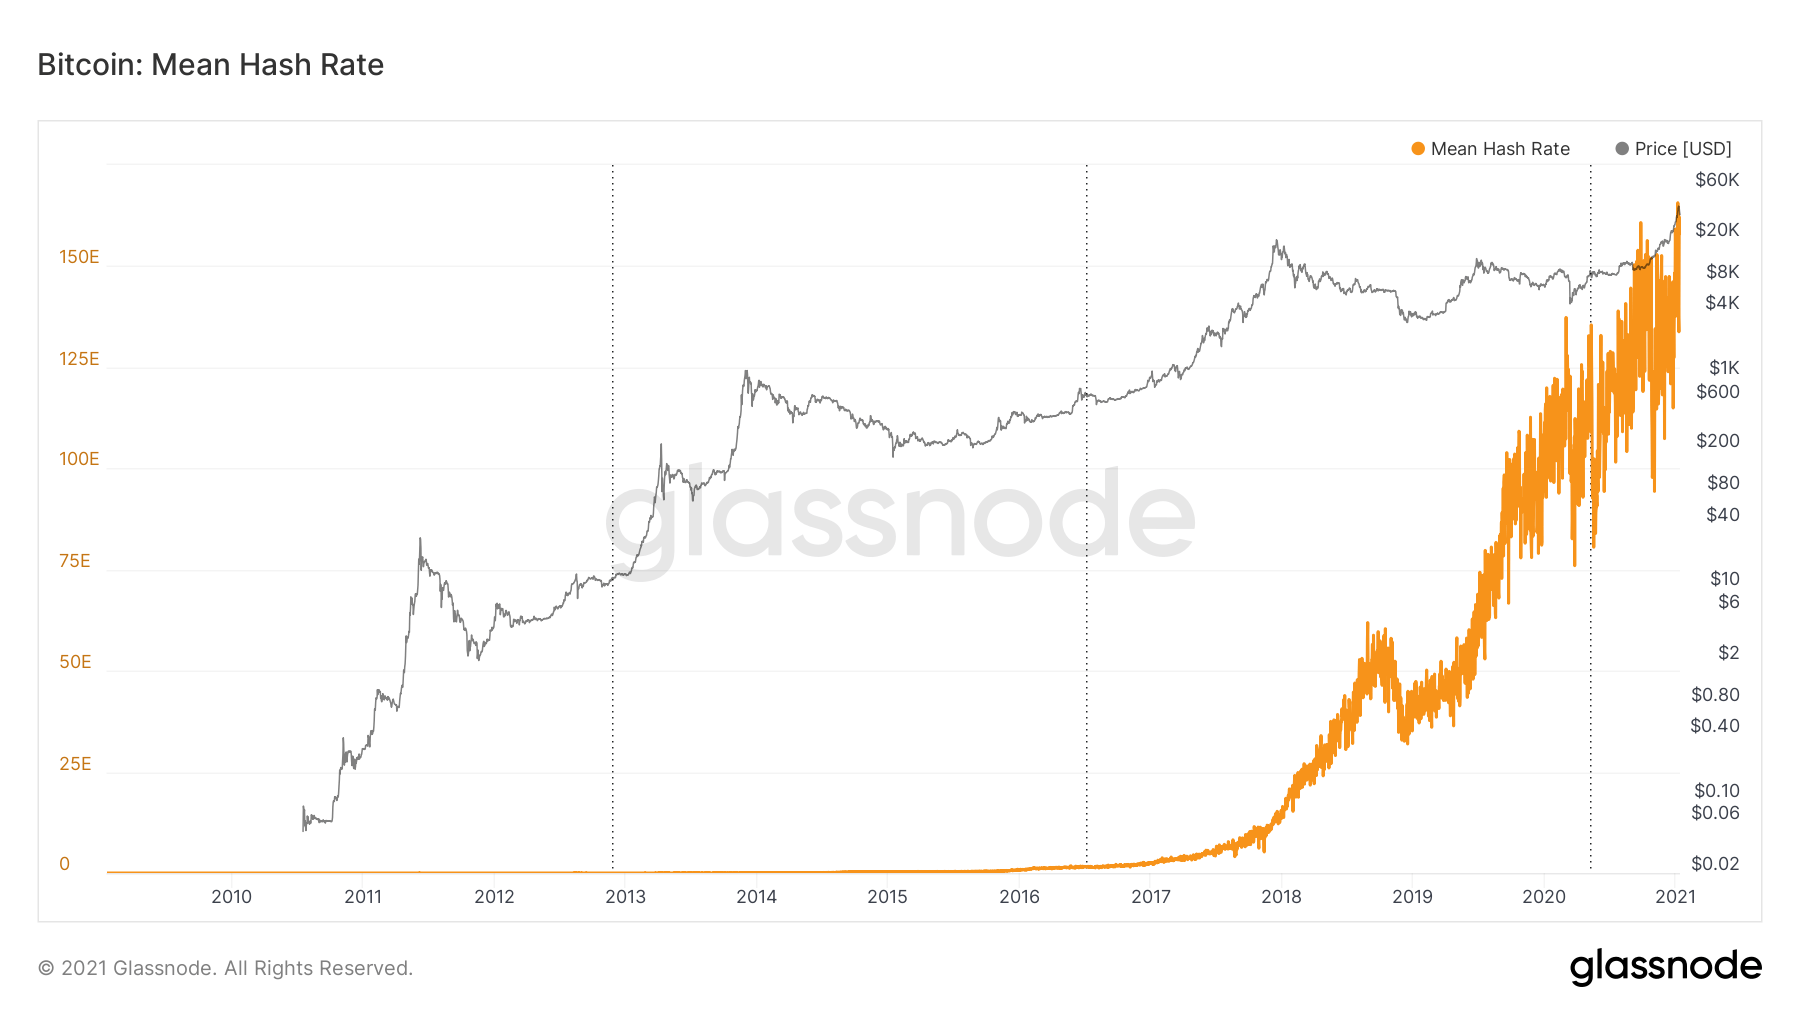
Bitcoin Hash Rate chart
In conclusion, the uptrend in these on-chain metrics is a strong positive signal for Bitcoin’s future price action regardless of the ongoing correction. It can be viewed as growth in Bitcoin’s adoption over time and as an inflow of new investors, which may lead to the beginning of a new bullish cycle.
Author
FXStreet Team
FXStreet
Composed of a group of economic journalists and FX experts, the FXStreet content team produces and oversees all content published on FXStreet. It provides a purely journalistic approach to the Forex market.


