Four on-chain metrics scream correction ahead of Bitcoin price
- Bitcoin price rally might be nearing an end, based on several on-chain metrics.
- Based on historical data, BTC is approaching overbought territory.
- Regardless, there may be a chance for another leg up before the correction begins.

Bitcoin price has advanced more than 200% since mid-December 2020. Trading at $40,800, at the time of writing, the bull rally seems unstoppable as investors appear to have entered a state of FOMO. Regardless, a closer look into the pioneer cryptocurrency's on-chain metrics shows it is approaching overbought territory.
Bitcoin price is in the vicinity of a market top
MVRV Z-score is an on-chain metric that identifies whether BTC price is overvalued or undervalued by comparing it to its fair value. MVRV is the ratio of Bitcoin's market capitalization to its realized market capitalization. Using a Z-score to standardize this metric results in the MVRV Z-score metric.
A Z-score above seven has historically indicated that flagship cryptocurrency is overvalued and has a high chance of reversal. At the moment, this on-chain metric is moving closer to the danger zone, hinting that a steep correction is underway.
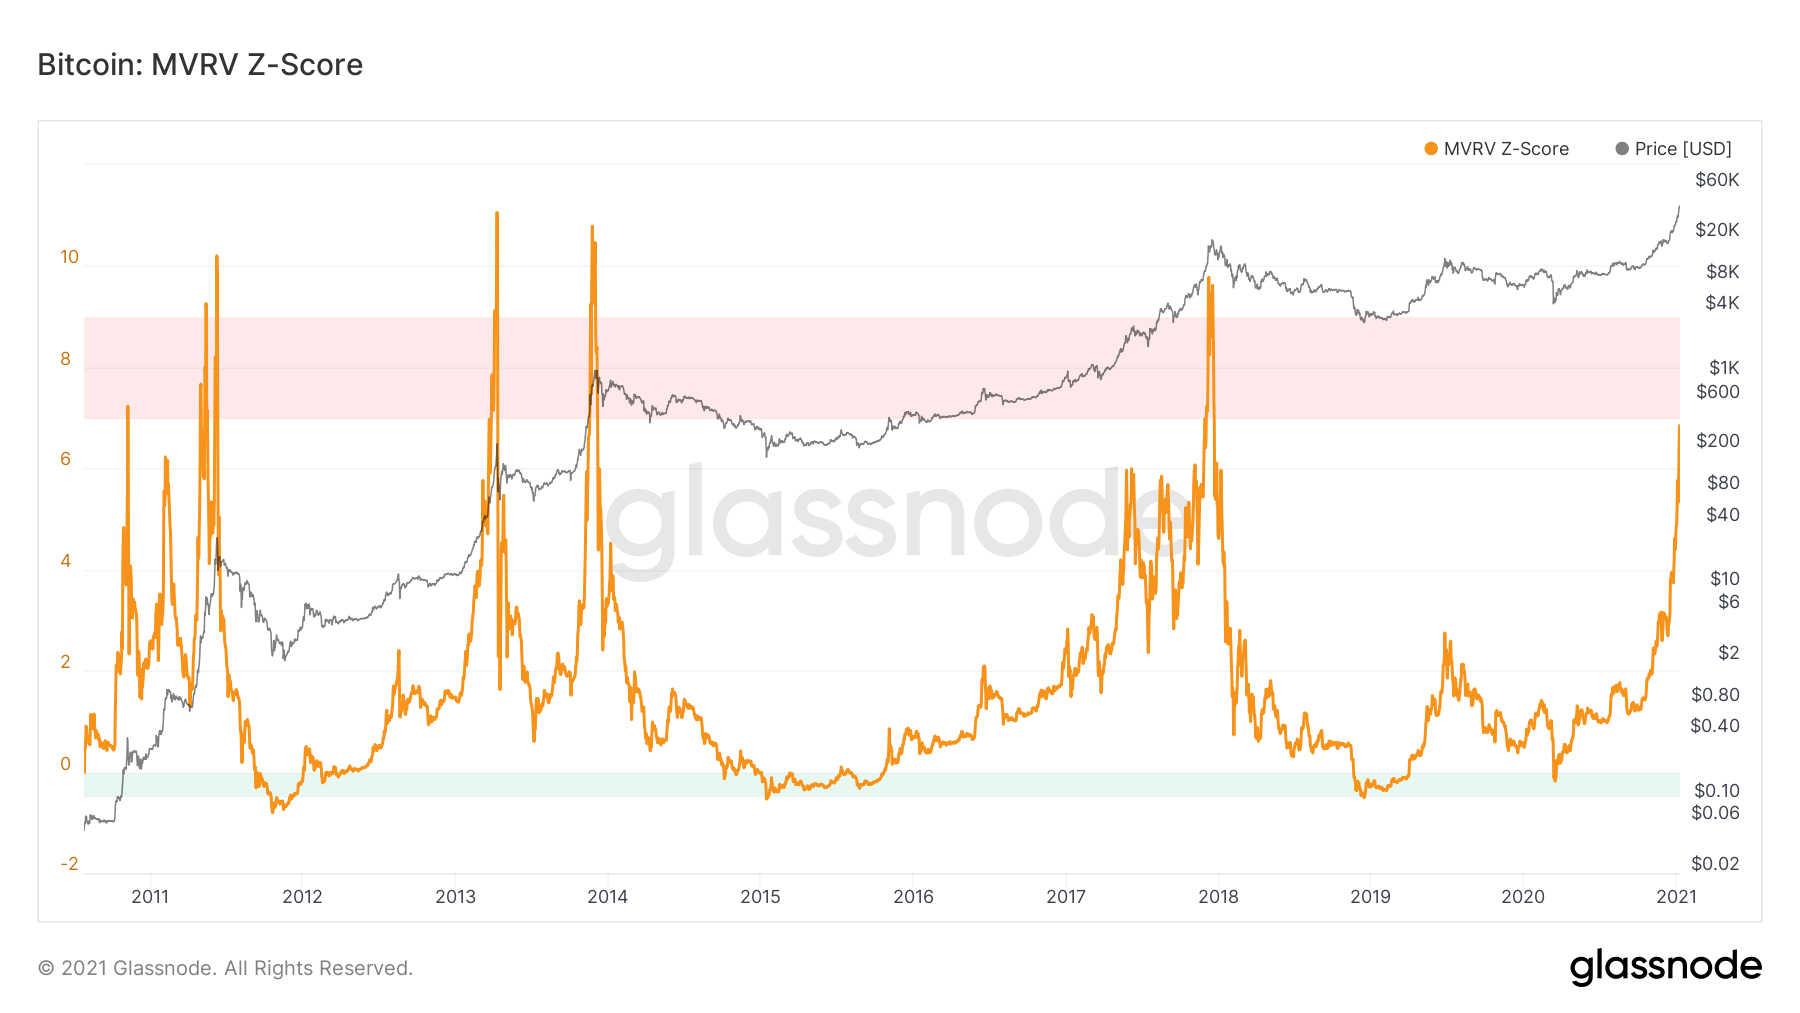
Bitcoin MVRV Z-score
It is worth mentioning that during the 2013 and 2015 bull cycles, Bitcoin's Z-score tore through the red band while prices advanced further. A similar market behavior occurred during the 2017 bull run, with the correction developing a month after the Z-score's red band was breached.
Spent Output Profit Ratio [SOPR] is another on-chain metric that helps identify whether Bitcoin holders are in profit or a loss, thus anticipating a sell-off. If the SOPR metric is greater than 1, it implies that holders are in profit. Adjusted SOPR is a metric derived from SOPR by ignoring all the outputs in less than an hour.
A spike in aSOPR shows that holders are in profit. However, a closer look reveals that aSOPR hasn't reset since late September. An eerily similar surge in aSOPR was observed starting in late September 2017, which resulted in the rally topping after three months.
-637458009672746931.png)
Bitcoin aSOPR chart
Liquid Supply Change is a metric that draws a picture of BTC flows to and from liquid holders. Liquid holders, in simple terms, represent addresses that tend to hold Bitcoin for a prolonged period. Based on this metric, when tokens are flowing to strong holders, the red histogram increases. Conversely, the spike in green histograms or receding red histograms has historically represented a reversal of bull rallies.
The red histograms show exhaustion signs at press time, indicating a reversal for the top crypto might be underway. In 2017, a similar spike in BTC moved to liquid holders happened, followed by the end of the bullish cycle and the beginning of a corrective period.
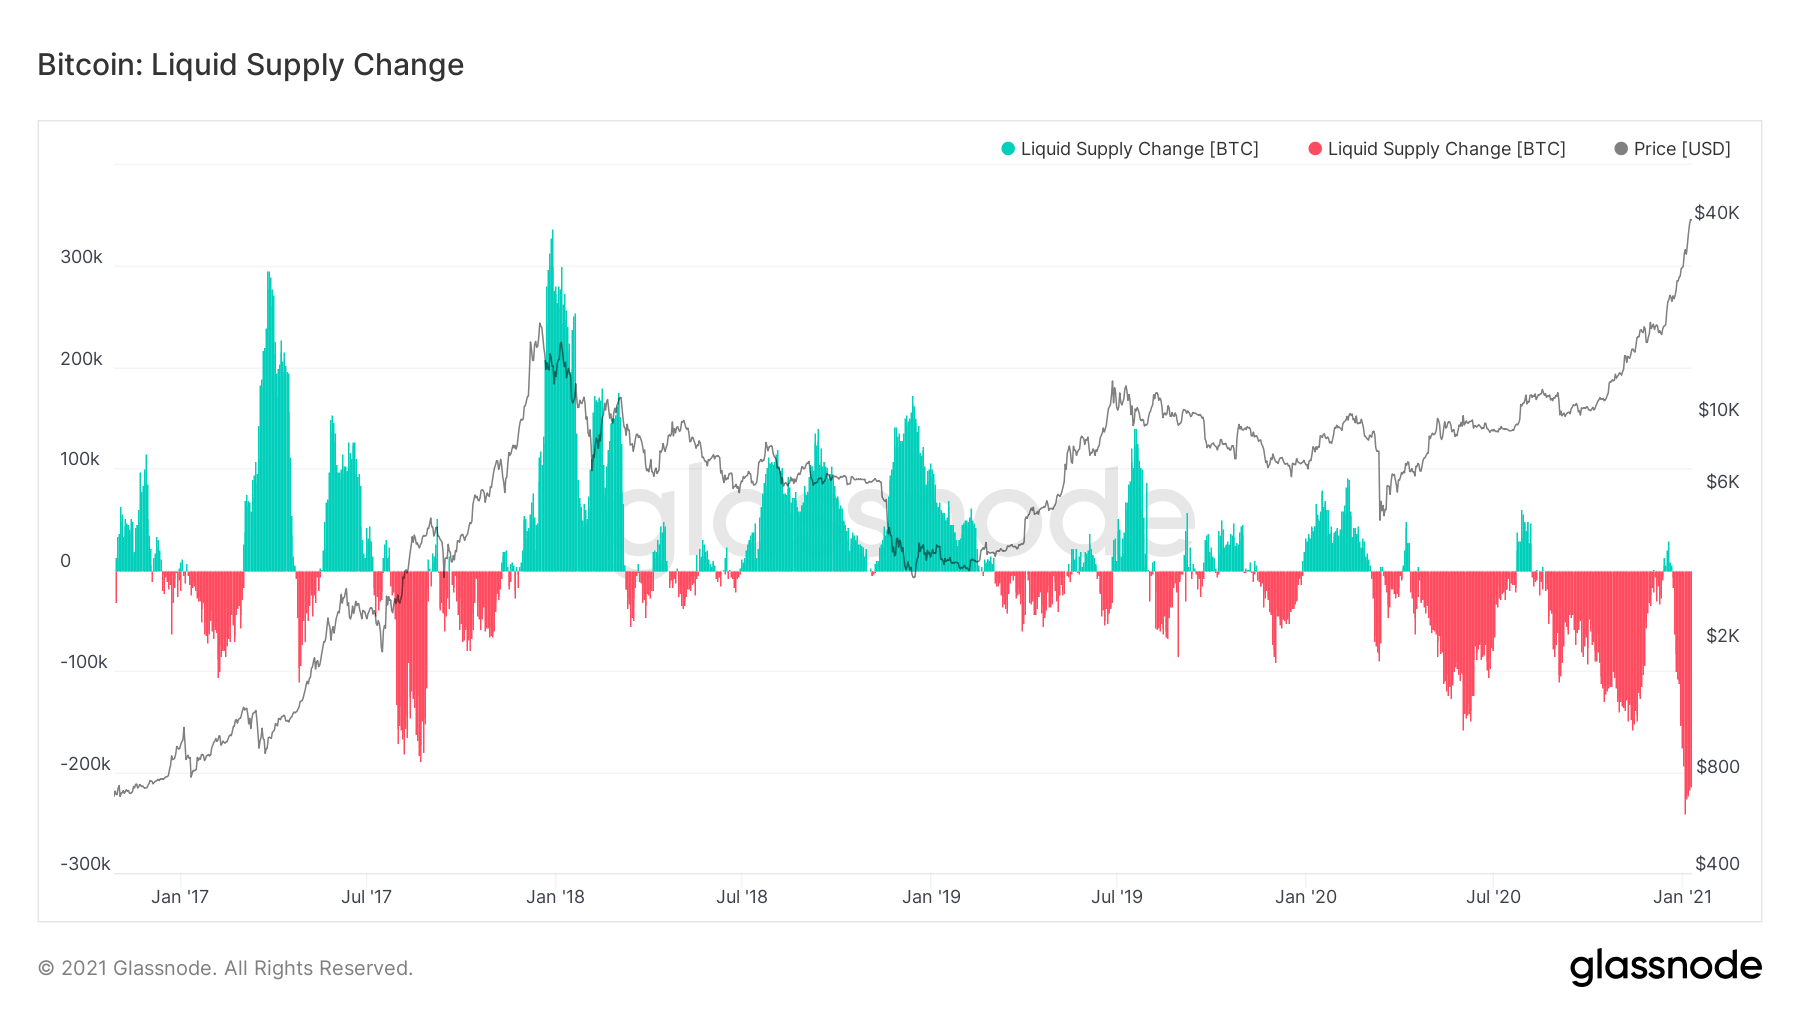
Bitcoin Liquid Supply chart
Moving Average Convergence Divergence is a technical indicator used to identify an asset's overall trend. Since the indicator consists of moving averages of varying lengths, crossovers help determine a change in the underlying asset's direction. It also helps to anticipate price moves by spotting divergences between the price and indicator.
LMACD takes the logs of both the moving averages to give a more reliable and comprehensive understanding of the overall long-term trend of an asset. In this case, LMACD has been a reliable indicator to identify tops on Bitcoin's trend. A trendline connecting the tops of LMACD rallies from 2011 through 2020 shows that a reversal might be underway soon.
%20(1)-637458011116934602.png)
BTC/USD 1-week chart
To conclude, it seems like several on-chain and technical metrics suggest that Bitcoin price is bound for a steep decline. Since some of the indicators are yet to head into the overbought/overvalued territory, the incoming correction may take some time to materialize.
Indeed, trading veteran Peter Brandt believes that Bitcoin price could advance towards $50,000 before a meaningful retracement occurs. But given the recent bull rally's slope, the technical analyst suggests that it is not the right time to buy BTC.
Author
FXStreet Team
FXStreet
Composed of a group of economic journalists and FX experts, the FXStreet content team produces and oversees all content published on FXStreet. It provides a purely journalistic approach to the Forex market.


